
Insurance Performance Dashboard
Understand insurance business performance to improve profitability and risk management.
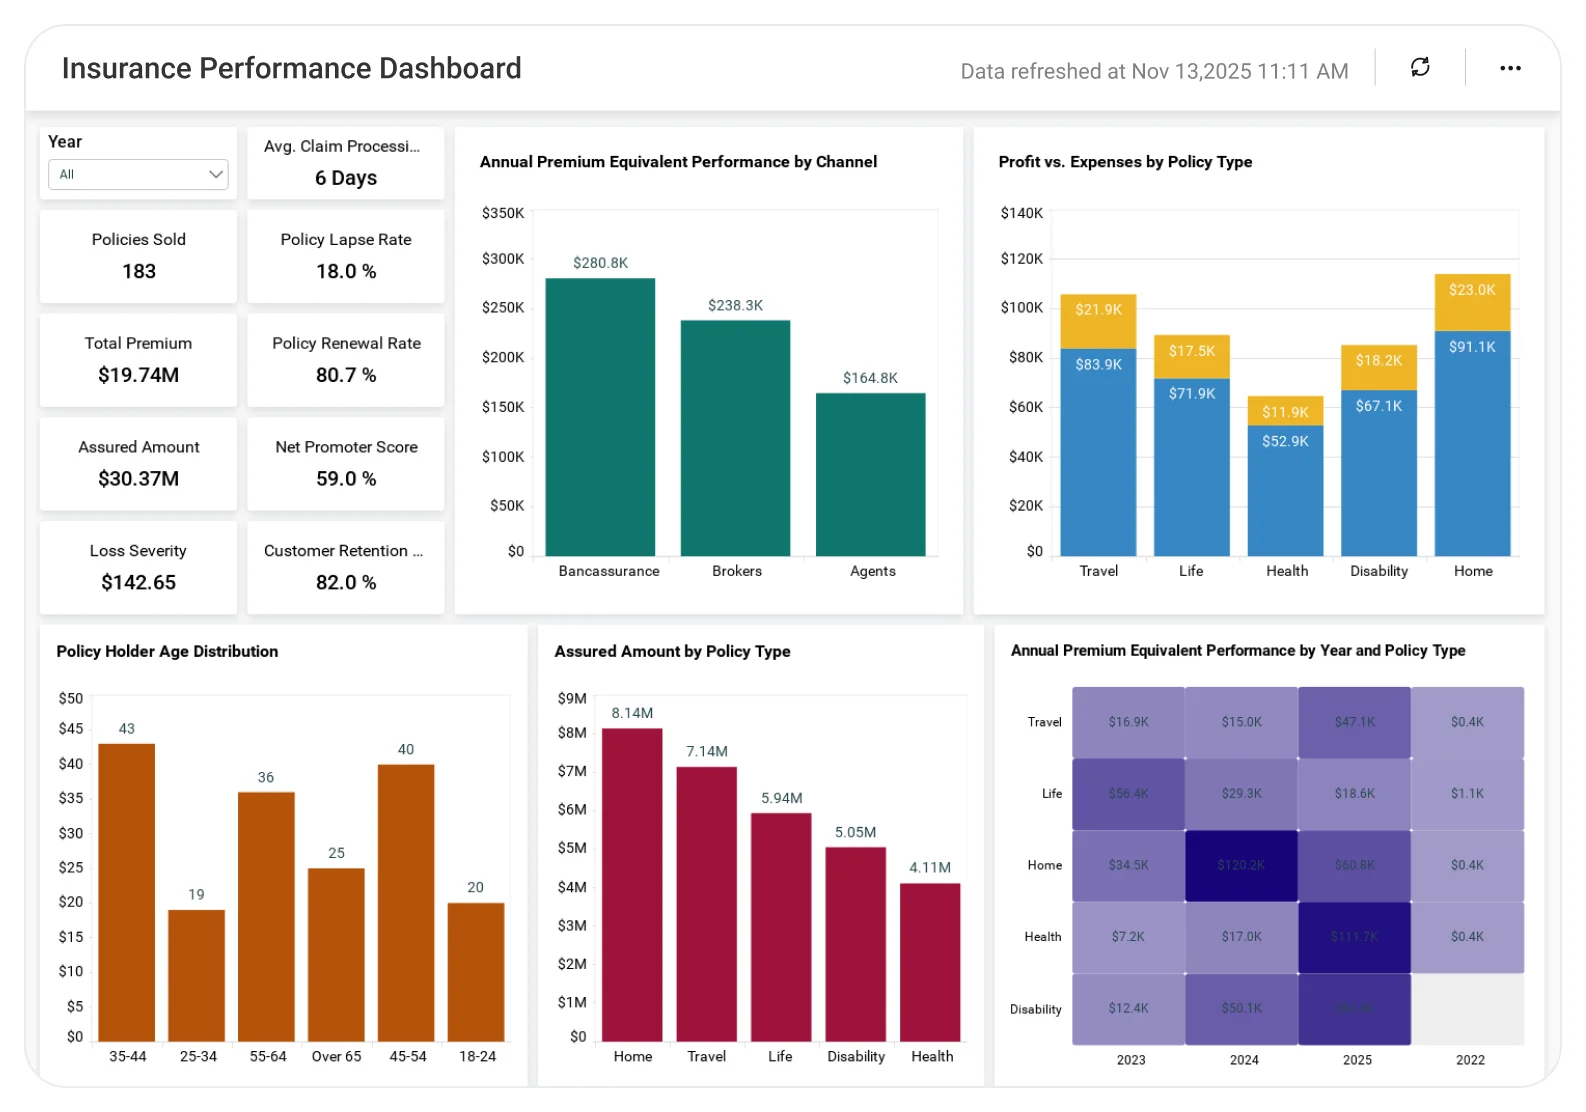
The Insurance Performance Dashboard helps insurers analyze policy performance, premium revenue, claims ratios, and portfolio trends, enabling better underwriting decisions, cost control, and sustainable business growth.
TL;DR
-
Annual premiums compared with total amounts assured.
-
Policy counts and assured amount by insurance type.
-
Sales contribution by agents, brokers, and bancassurance.
-
APE performance by region, channel, year, and category.
-
Profit versus APE comparison.
What Is an Insurance Performance Dashboard?
An Insurance Performance Dashboard is a visual analytics solution that helps insurers monitor sales effectiveness, coverage levels, and profitability across products and channels.
In Bold BI, it becomes an interactive dashboard with KPIs, charts, and filters that automatically update from insurance data sources.
Why Insurance Performance Dashboard Matters
Insurance organizations must balance growth, coverage exposure, and profitability across multiple products and sales channels.
Without a centralized dashboard:
-
Sales performance across channels is hard to compare.
-
Customer demand by policy type is unclear.
-
Profitability trends remains fragmented.
Bold BI brings premiums, assured amounts, APE, and profits into one dashboard so leaders can compare performance and make informed decisions.
What You’ll Track
-
Premiums & assured amounts: Comparison of annual premiums against total assured amounts to understand coverage growth.
-
Policy mix analysis: Breakdown of assured amounts by insurance type to assess customer demand.
-
Sales channel performance: Contribution from agents, brokers, and bancassurance to overall sales.
-
APE performance: Annual Premium Equivalent analyzed by region, sales source, year, and policy category.
-
Profitability insights: Profit versus APE comparison across insurance types to evaluate margins.
All dashboards are fully customizable, allowing you to add KPIs or metrics as needed.
How It Works(No-Nonsense Setup)
-
Select the Insurance Performance Dashboard sample.
-
Blend premiums, assured amounts, APE, sales channel, and profit data in one view.
-
Share role-based dashboards with leadership, regional heads, and sales managers.
-
Monitor performance trends and act quickly on channel, region, or profitability gaps.
Why Bold BI Is the Right Fit for Insurance Performance Analytics
-
Centralized KPI tracking: Monitor premiums, assured amounts, APE, and profitability metrics together.
-
Channel & region insights: Compare performance across sales channels, regions, policy types, and time periods.
-
Interactive drilldowns: Drill from high-level KPIs down to detailed sales, policy, and profitability views.Interactive drilldowns: Drill from high-level KPIs down to detailed sales, policy, and profitability views.
-
Growth-focused insights: Understand customer demand by policy type to support insurance growth strategies.
-
Deploy flexibly: Supports cloud and self-hosted deployment environments for insurance operations.
Compare Options (at a glance)
| Feature | Bold BI Insurance Performance Dashboard | Insurance Reports | Spreadsheets |
| Premium & assured amount tracking | Yes | Limited | Manual |
| Sales channel performance analysis | Yes | Limited | Manual |
| APE performance insights | Yes | Limited | Manual |
| Profitability comparison | Yes | Limited | Manual |
| Executive-ready dashboards | Yes | Limited | No |
Frequently Asked Questions
More Articles About Insurance Performance
-
Increasing Insurance Claim Accuracy with Business Intelligence
 This blog explains how insurance companies can use Bold BI® to build dashboards that analyze claims data helping identify patterns, detect anomalies, and improve claim accuracy and operational decision-making with interactive business intelligence insights.
-
Maximize Insurance Company’s Revenue with Embedded Analytics
This blog explains how Bold BI® helps insurance companies build revenue performance dashboards that visualize key metrics such as premiums, claims, sales trends, and profitability enabling teams to monitor performance and improve decision-making using interactive visual analytics.


