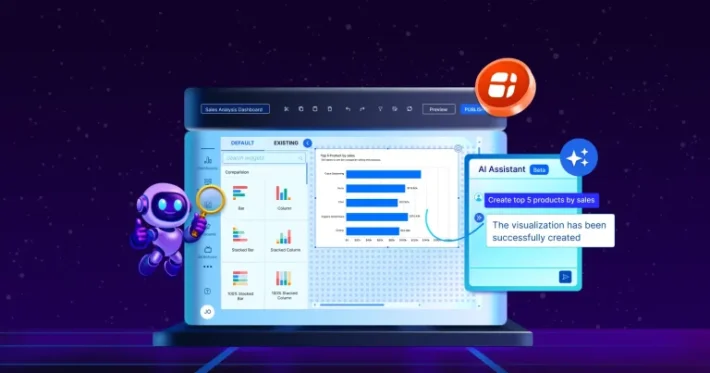
21 Revenue Dashboards and KPIs to Track Business Growth

 18 min read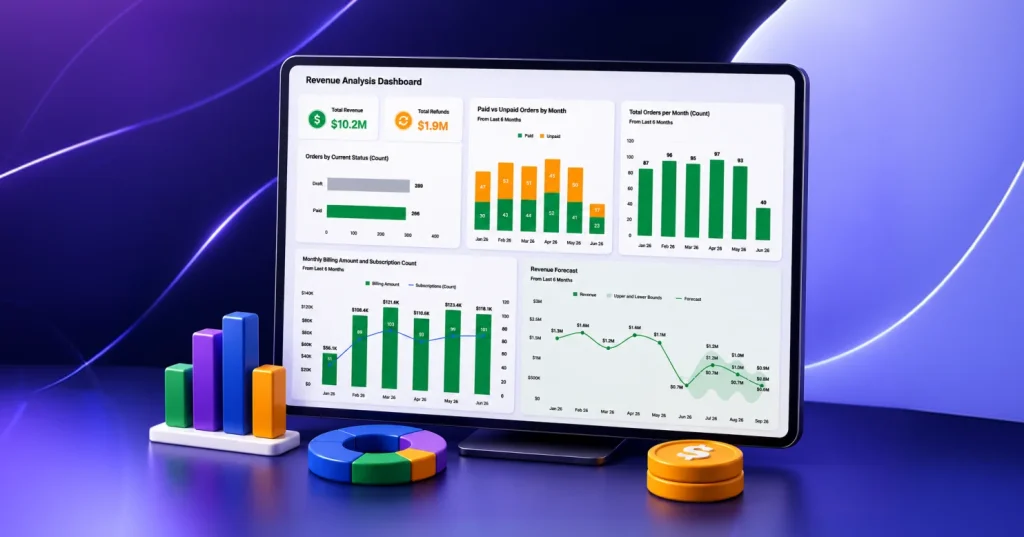
TL;DR: Revenue data rarely lives in one system. Sales, finance, marketing, and subscription teams often work from different analytics systems, making it difficult to understand what drives business growth. A revenue dashboard brings these insights together, helping organizations monitor revenue performance, recurring revenue, profitability, and growth opportunities from a single view.
Introduction
Revenue is one of the most important indicators of business performance, but understanding what drives revenue growth requires visibility into more than just revenue totals. Sales activity, subscriptions, customer retention, marketing campaigns, refunds, and financial performance all contribute to business outcomes, making it difficult to identify growth opportunities when data is spread across multiple systems.
Revenue dashboards and KPIs help organizations bring these metrics together in a centralized analytics environment. By tracking revenue, subscriptions, opportunity value, profitability, and customer trends in one place, teams can monitor performance, uncover patterns, and make faster, data-driven decisions.
In this guide, we’ll explore 21 revenue dashboard examples, essential revenue KPIs, common revenue tracking challenges, and best practices for designing dashboards that support sustainable business growth.
What Is a Revenue Dashboard?
A revenue dashboard is a centralized analytics solution that helps organizations monitor revenue KPIs, evaluate financial performance, and understand the factors influencing business growth. Rather than reviewing separate reports across sales, finance, marketing, and subscription platforms, stakeholders can access revenue-related insights through a single, interactive view.
Who Can Benefit from These Revenue Dashboard Examples?
A revenue dashboard provides valuable insights to multiple stakeholders:
- CFOs and finance teams track revenue performance, refunds, collections, profitability, and forecasting.
- Sales leaders monitor revenue trends by product, territory, sales channel, and team performance.
- Revenue operations teams monitor recurring revenue, renewals, retention, churn, and customer growth.
- Executives gain visibility into revenue quality, business health, and growth opportunities.
- Business analysts uncover revenue trends, identify opportunities, and support strategic decision-making.
By providing a shared view of revenue performance, dashboards help align teams around consistent metrics, improve collaboration, and support more informed business decisions.
Next, let’s look at some of the challenges businesses are facing when tracking revenue.
Common Revenue Tracking Challenges Businesses Face
Organizations often struggle to maintain visibility into revenue performance because revenue data is spread across multiple systems. Common challenges include:
- Data silos across departments: Sales, finance, marketing, and customer success teams often track revenue-related metrics in separate platforms.
- Inconsistent KPI definitions: Different teams may calculate revenue, churn, customer value, or forecast metrics differently.
- Manual analytics processes: Exporting and combining data from multiple systems increases the risk of errors and delays.
- Limited visibility into recurring revenue: Subscription businesses often struggle to monitor renewals, churn, upgrades, and downgrades in one place.
- Difficulty identifying growth drivers: Revenue changes are hard to explain when supporting metrics remain disconnected.
- Delayed decision-making: Stakeholders may rely on outdated dashboards instead of real-time insights.
Together, these challenges can limit visibility into both revenue performance and the factors driving sustainable growth.
How a Revenue Dashboard Solves These Challenges
A revenue dashboard helps organizations overcome common revenue tracking challenges by centralizing data, standardizing metrics, and providing real-time visibility into performance.
- Breaks down data silos: Connects revenue data from CRM, subscription, payment, and finance systems into a single source of truth, eliminating the need to switch between multiple platforms.
- Standardizes KPI definitions: Ensures all teams work from the same revenue metrics and calculations, reducing confusion caused by inconsistent analytics.
- Reduces manual effort: Automates data collection and updates, minimizing spreadsheet exports, manual consolidation, and analytics errors.
- Improves recurring revenue visibility: Tracks subscriptions, renewals, churn, upgrades, and refunds in one place, helping businesses better understand recurring revenue performance.
- Makes growth drivers easier to identify: Combines revenue metrics with sales, marketing, and customer data to reveal the factors influencing business growth.
- Enables faster decision-making: Provides real-time access to revenue insights so stakeholders can respond quickly to risks and opportunities.
By transforming disconnected data into a unified view, a revenue dashboard helps organizations make more informed decisions and drive sustainable business growth.
Spreadsheets vs Revenue Dashboards
Spreadsheets are useful for calculations and one-off analysis, but managing revenue data across multiple systems can become difficult as organizations grow. A revenue dashboard provides a centralized view of revenue data, making it easier to monitor performance and access insights.
| Question | Spreadsheet | Revenue Dashboard |
| How is data updated? | Requires manual exports, imports, and updates | Automatically refreshes data from connected sources |
| How do teams collaborate? | Multiple versions can create inconsistencies | Everyone works from a shared source of truth |
| How is data from multiple systems analyzed? | Requires manual consolidation of data | Combines data from multiple systems in one view |
| How easy is it to identify trends? | Trends often require manual analysis and chart creation | Trends are visible through interactive visualizations |
| How quickly can stakeholders access insights? | Information often needs to be prepared before sharing | Insights are readily available through dashboards |
While spreadsheets remain valuable for detailed analysis, dashboards provide a more efficient way to monitor revenue performance and access insights from multiple data sources.
To better understand how these insights come together, let’s look at a revenue dashboard example.
Types of Revenue Dashboards: 21 Examples to Track Growth
Revenue dashboards and KPIs help organizations measure performance from different perspectives, including sales, subscriptions, marketing, finance, and industry-specific operations. The examples below highlight dashboards used to monitor sales performance, recurring revenue, marketing impact, financial performance, and industry-specific revenue trends.
Sales Revenue Dashboards
Sales revenue dashboards help teams understand revenue generation, pipeline performance, and sales effectiveness.
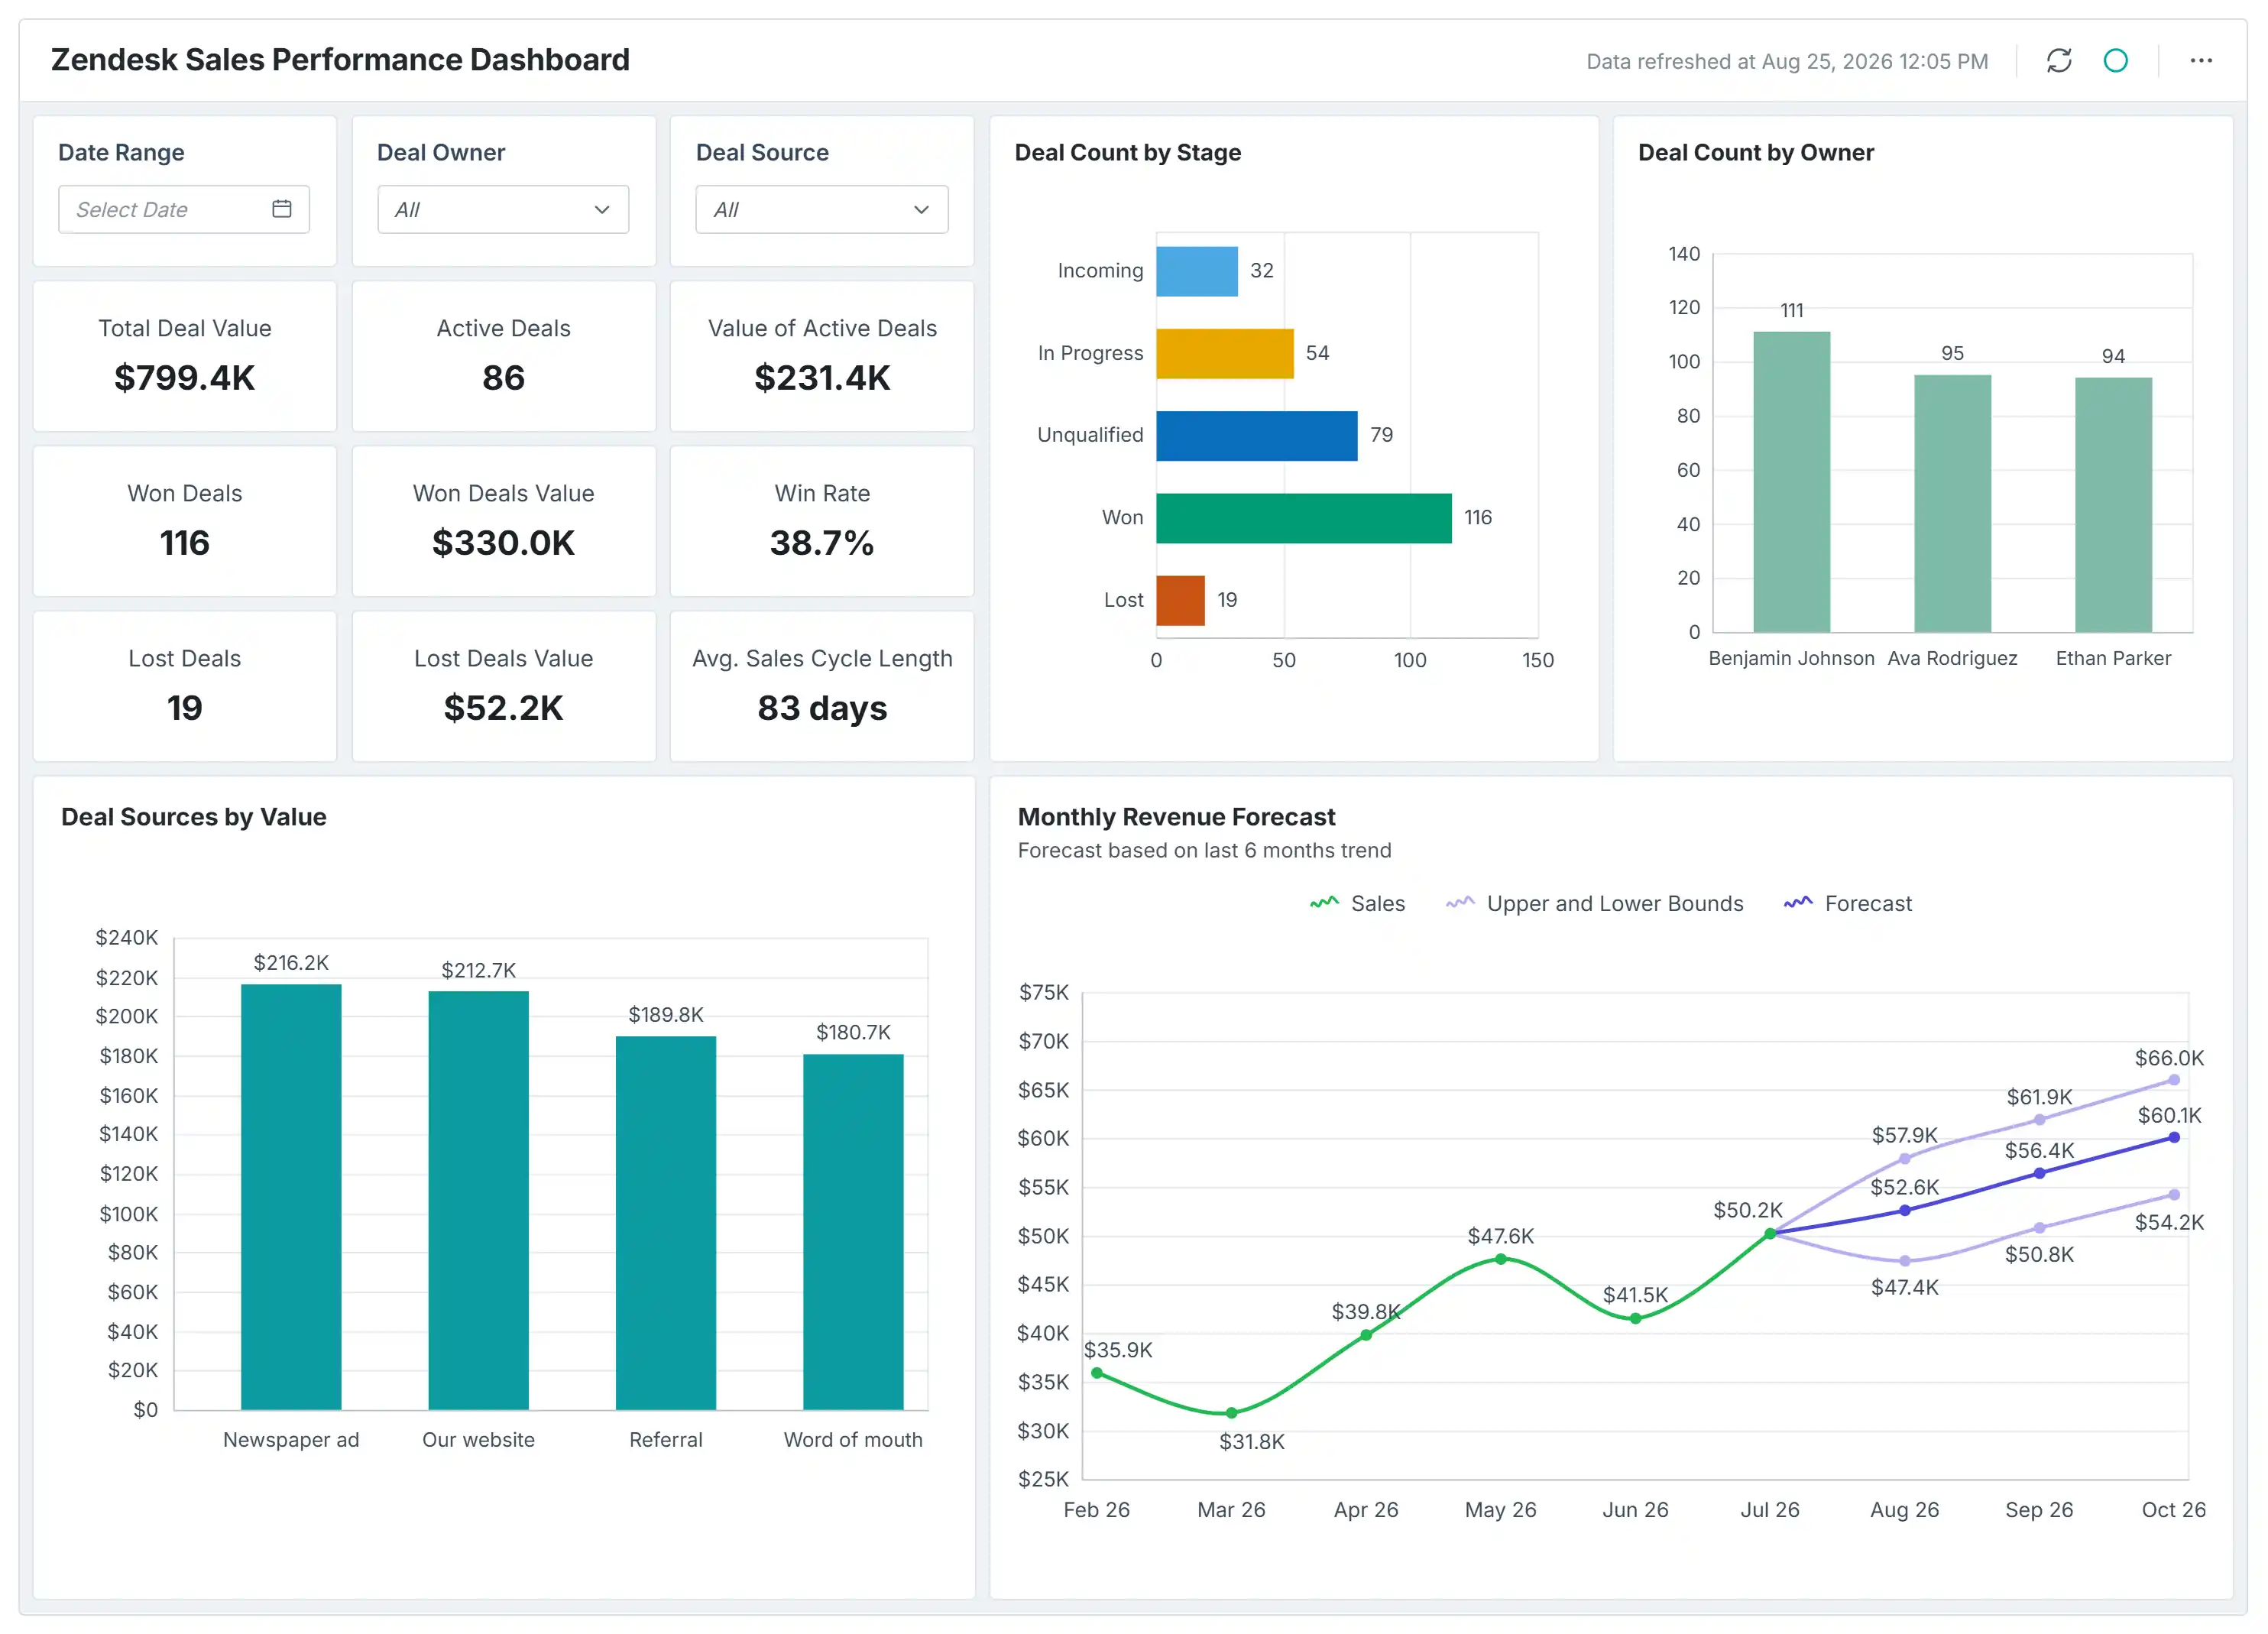
- Zendesk Sales Performance Dashboard helps sales teams identify deals that may be at risk of stalling before quarter-end and where the sales cycle is dragging, so reps can be redirected to save the forecast instead of finding out after the quarter closes.
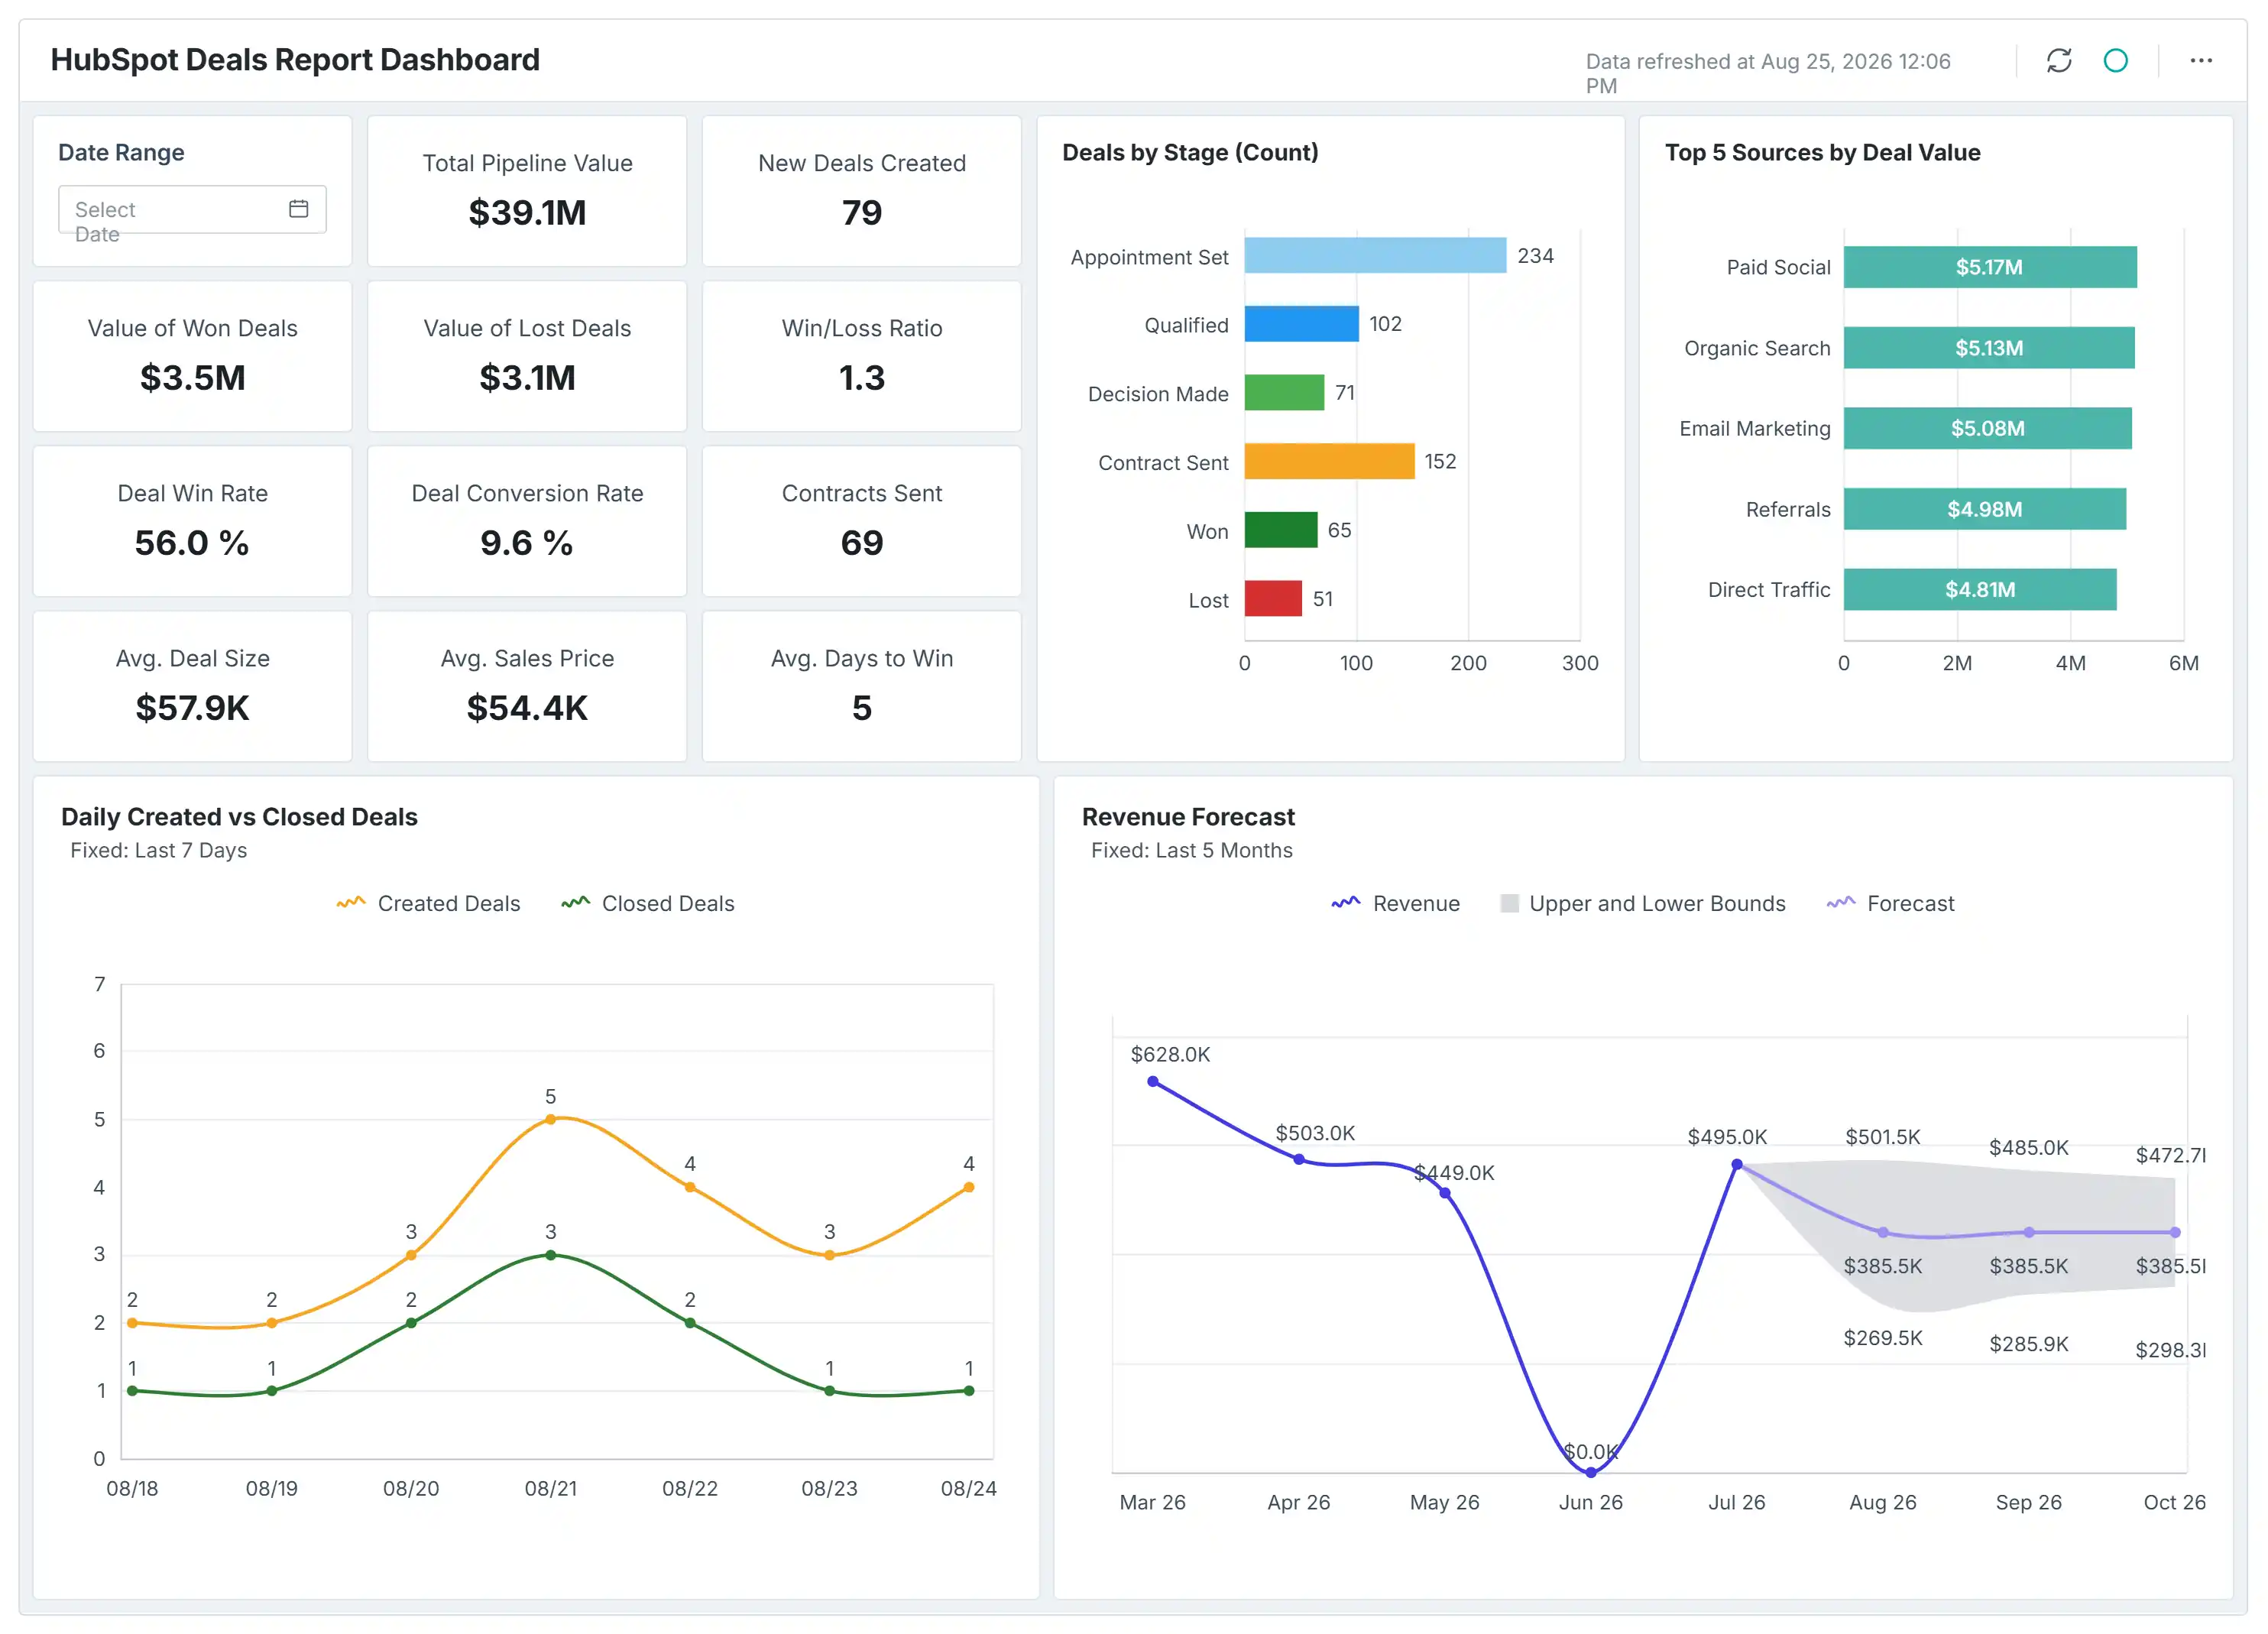
- HubSpot Deals Report Dashboard helps identify deals that may be at risk of slipping from the pipeline this month, so sales managers can step in with the right rep before a forecasted deal is lost instead of writing it off after the fact.
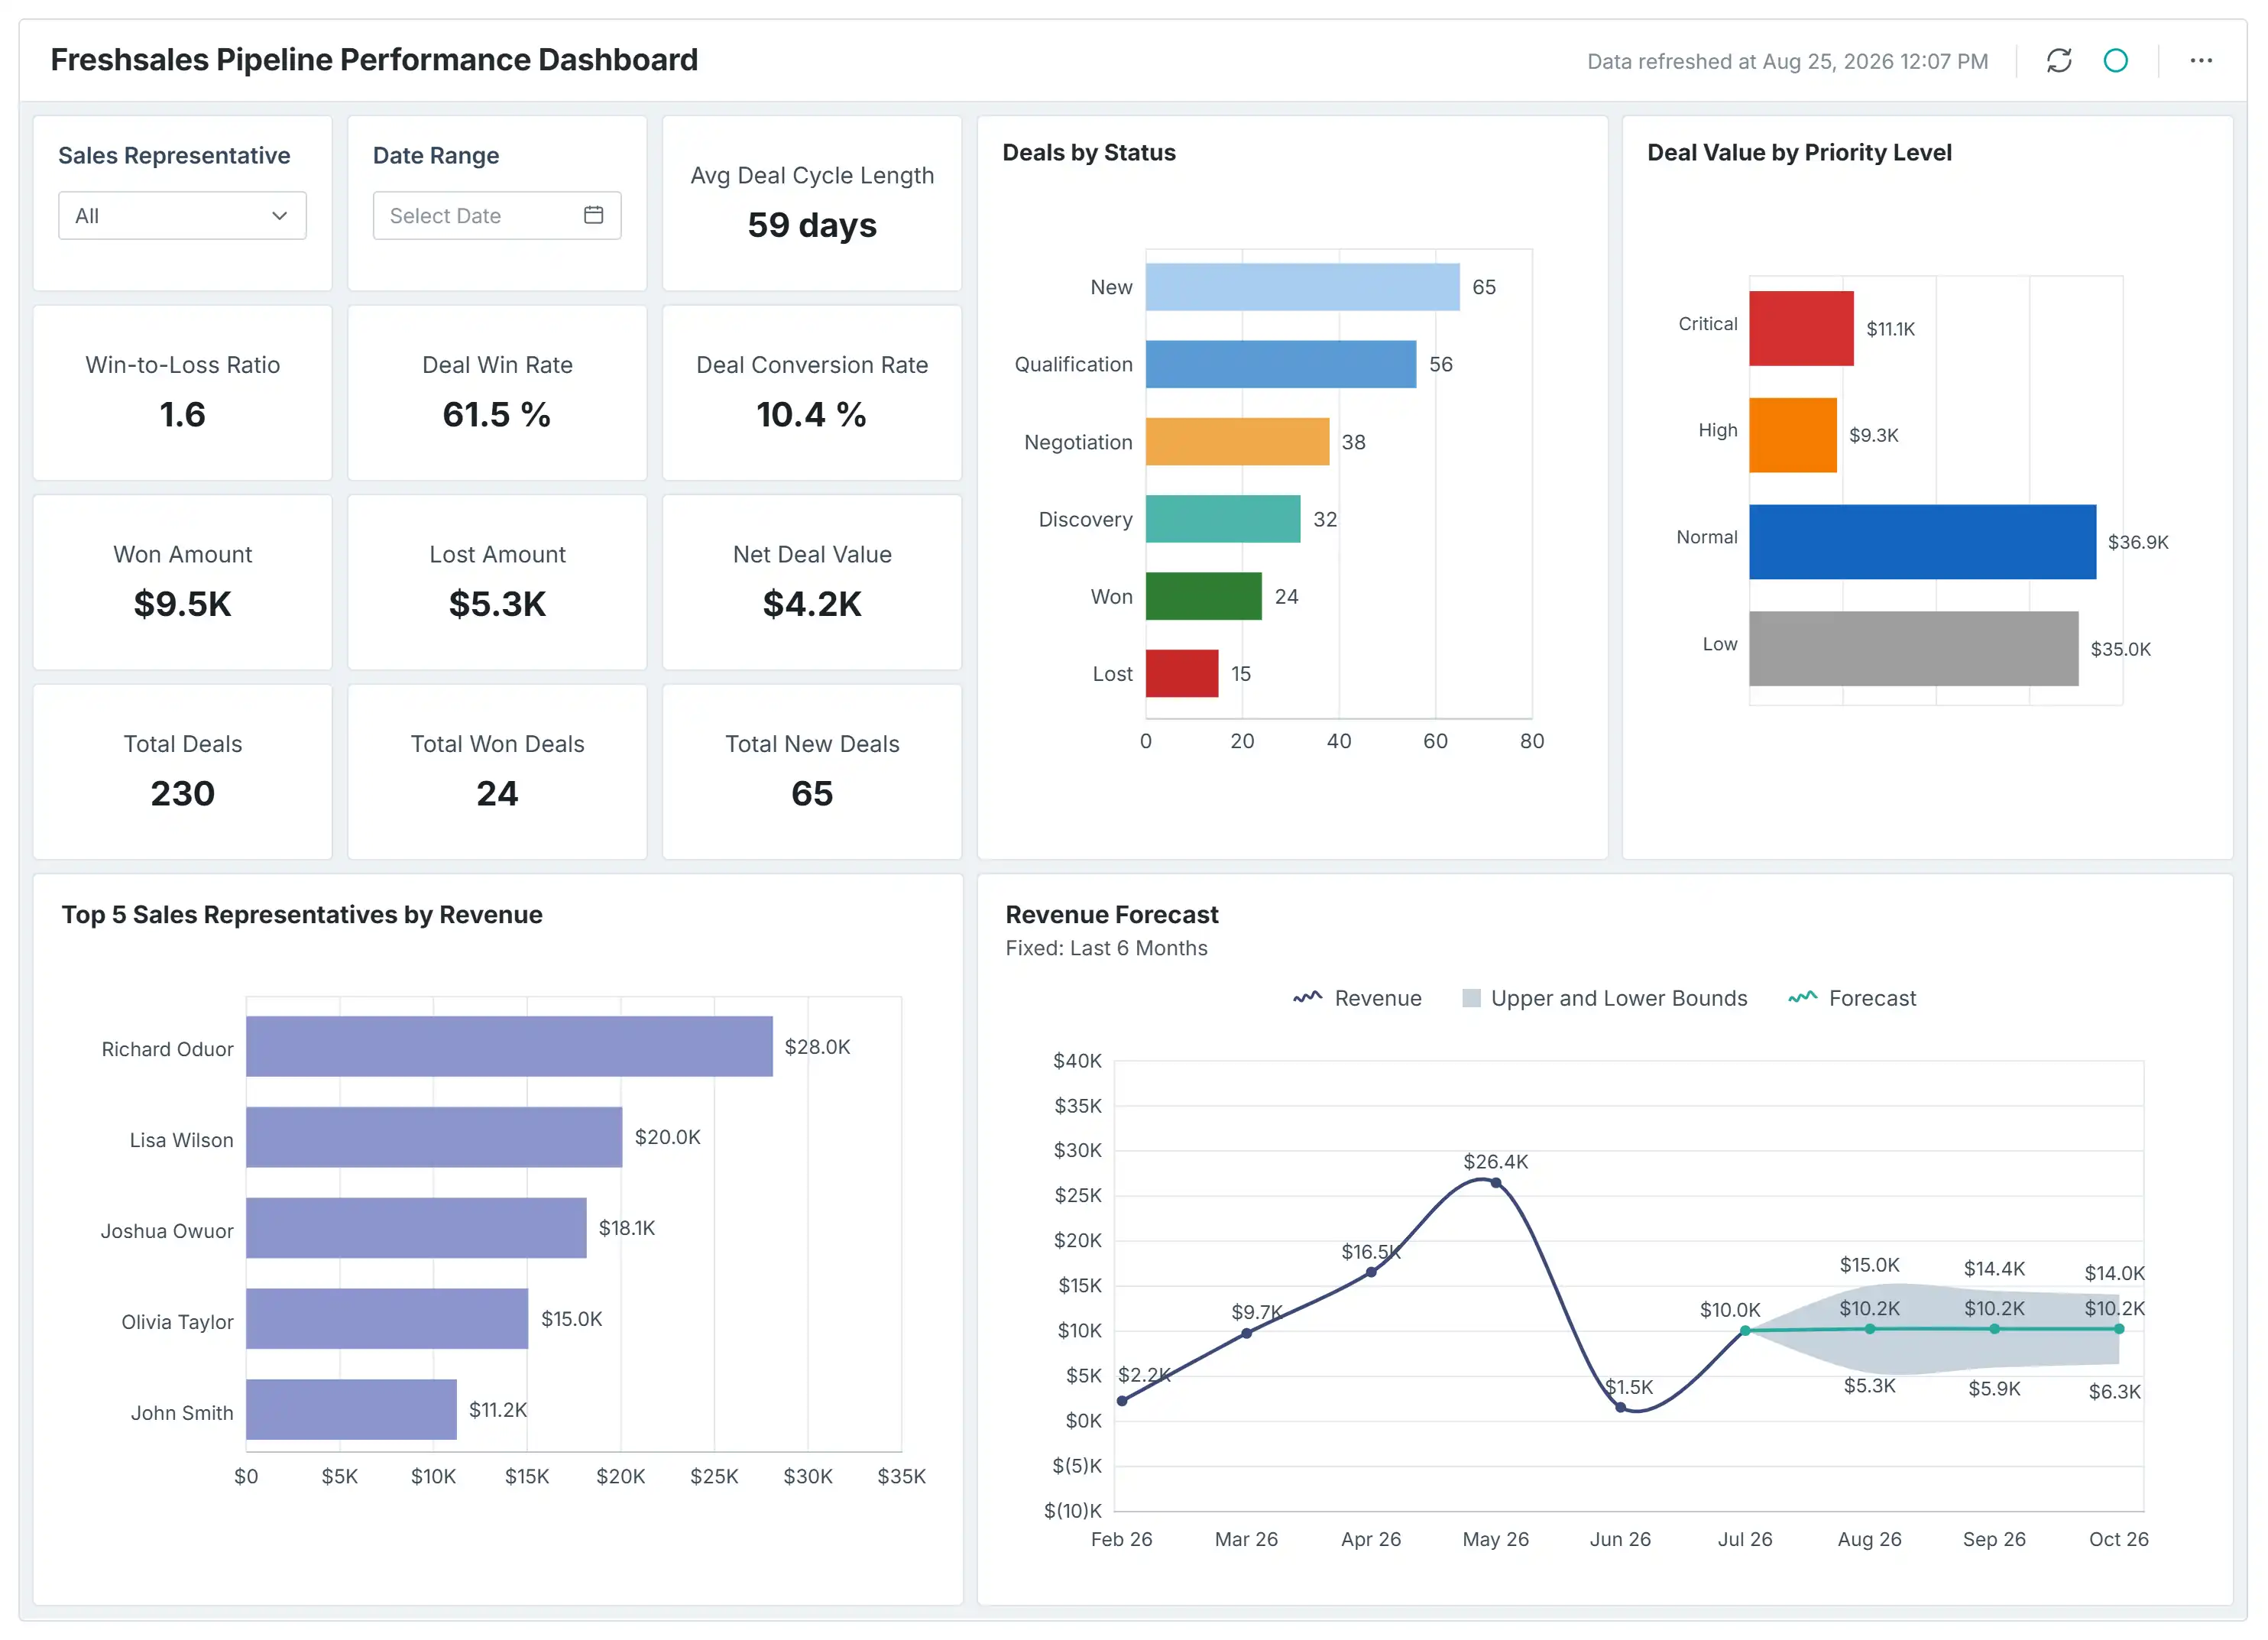
- Freshsales Pipeline Performance Dashboard helps identify where deals may be getting delayed in the pipeline, so teams can fix the bottleneck stage instead of guessing why conversion rates dropped.
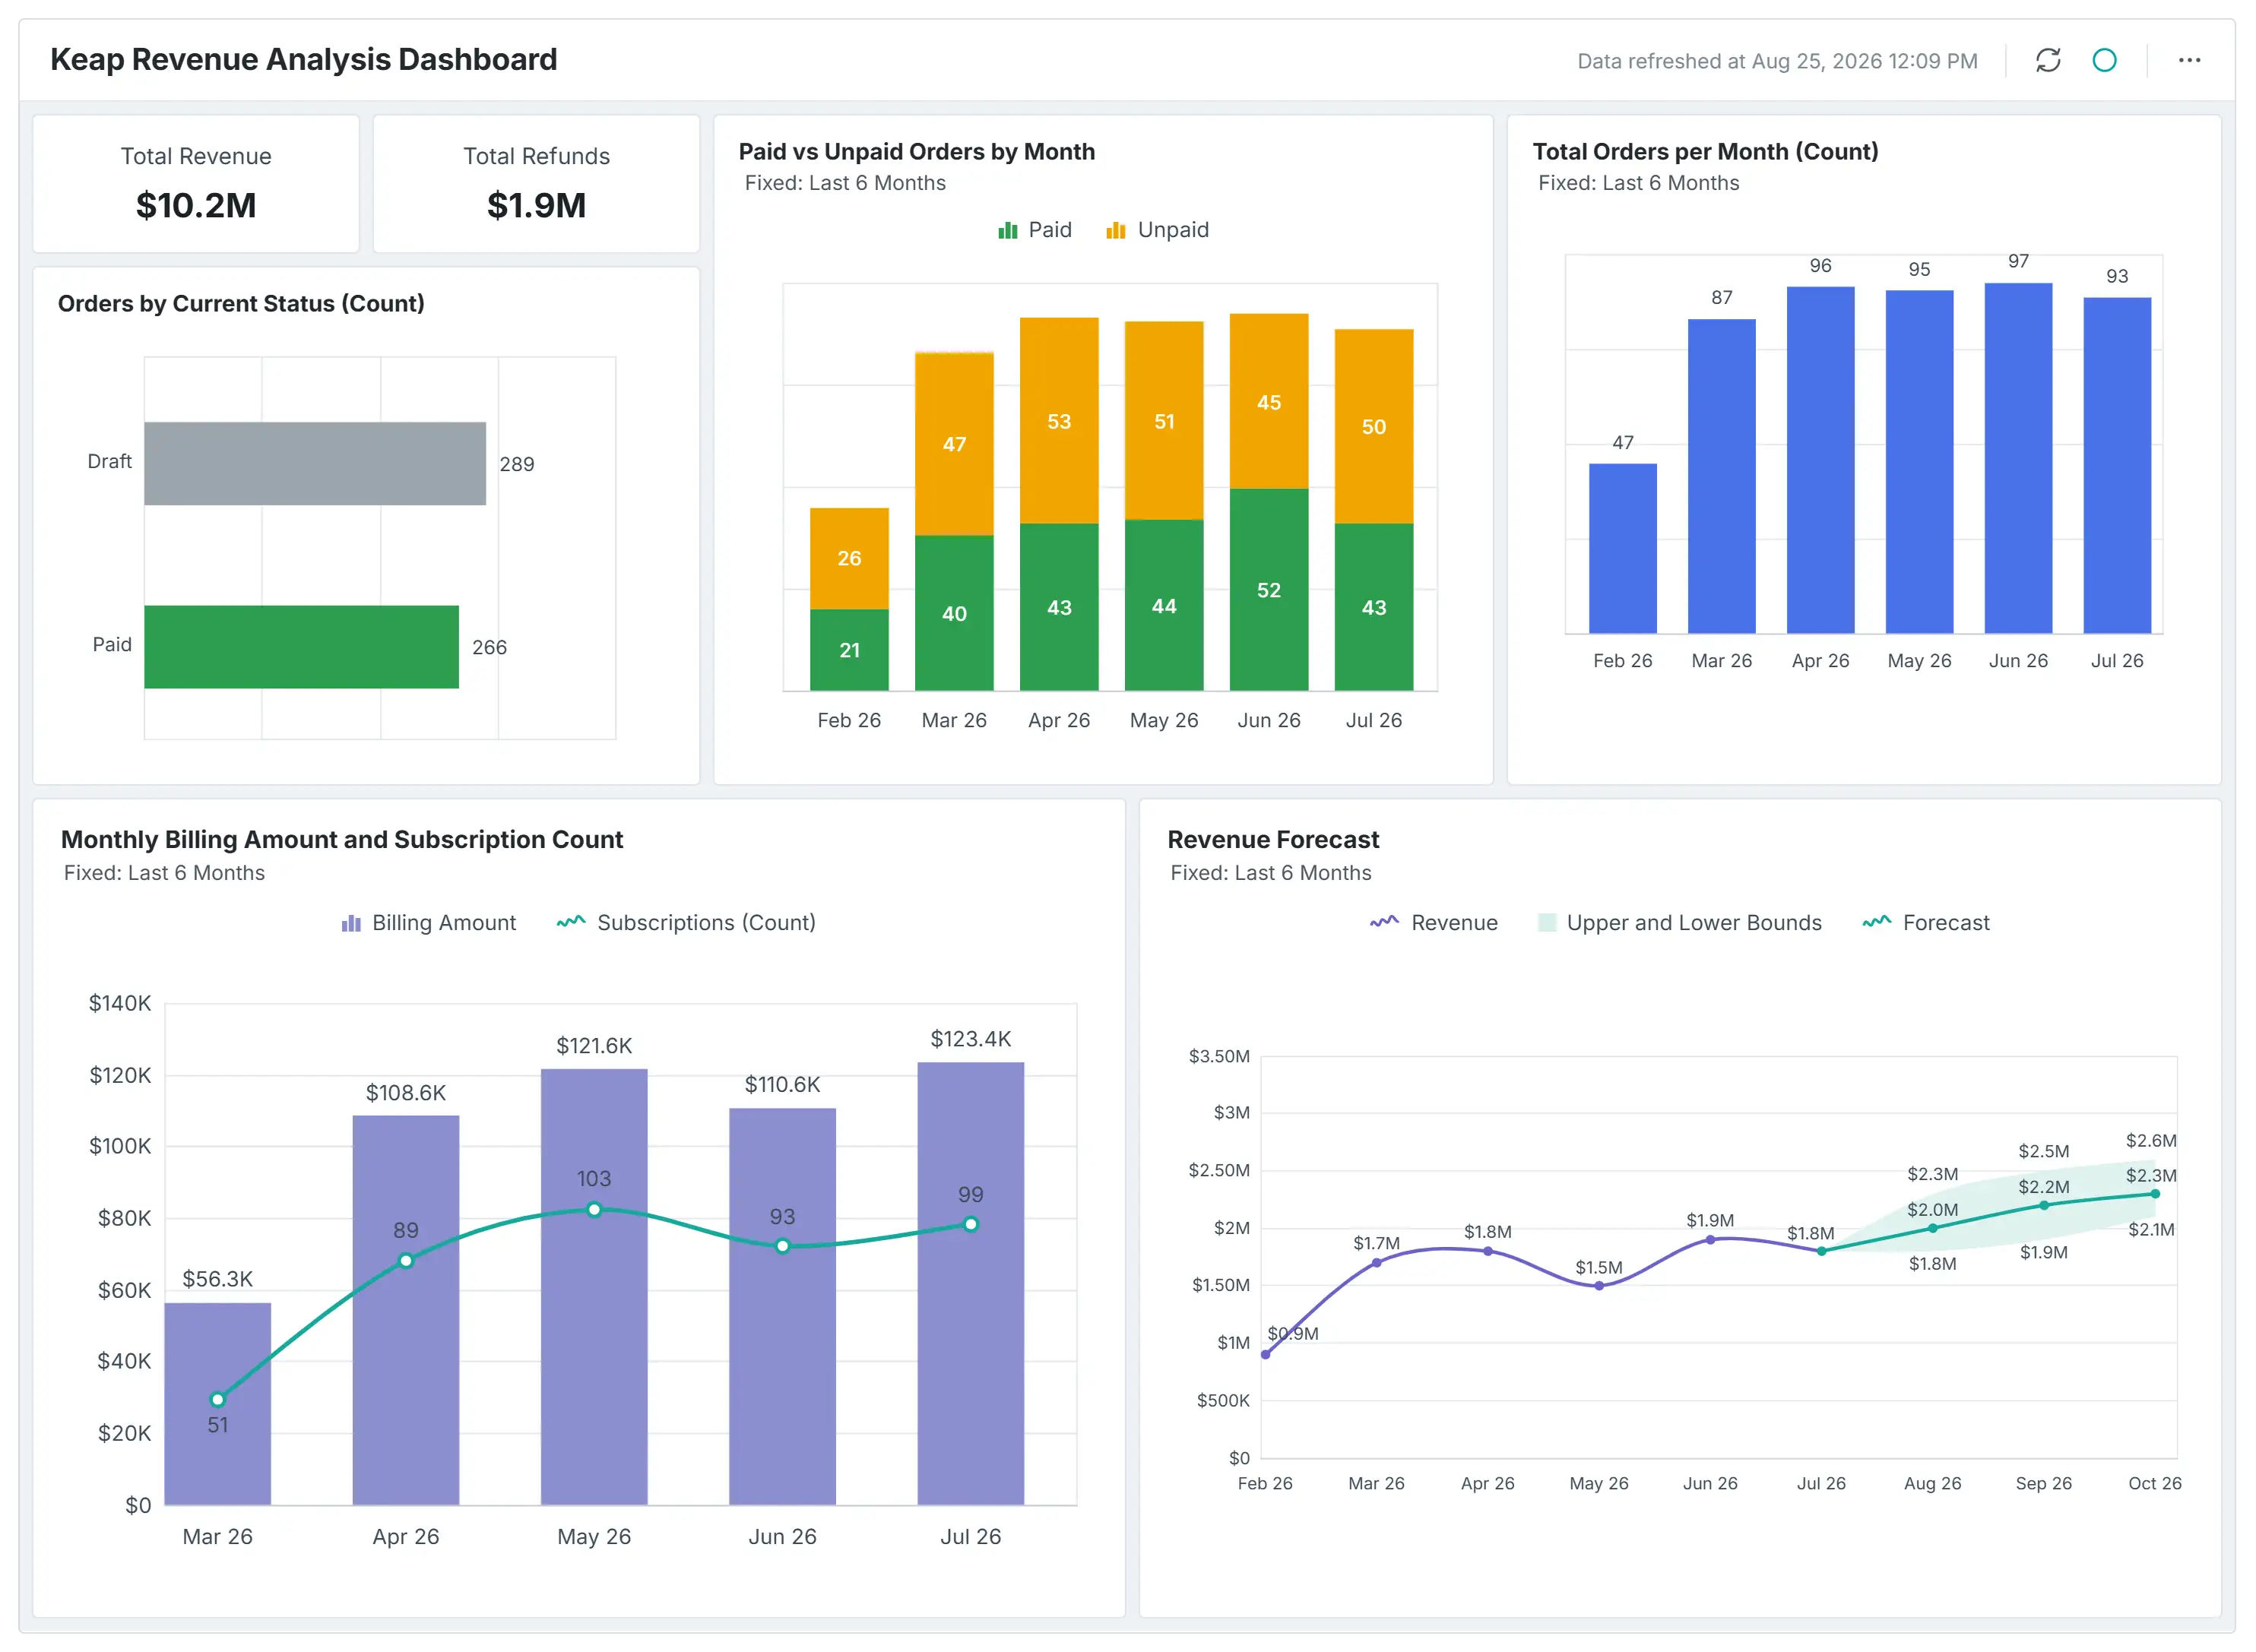
- Keap Revenue Analysis Dashboard connects refund activity directly to revenue trends, so finance can catch a revenue-quality problem, not just a revenue-total problem, before it appears in the next executive review or financial analytics cycle.
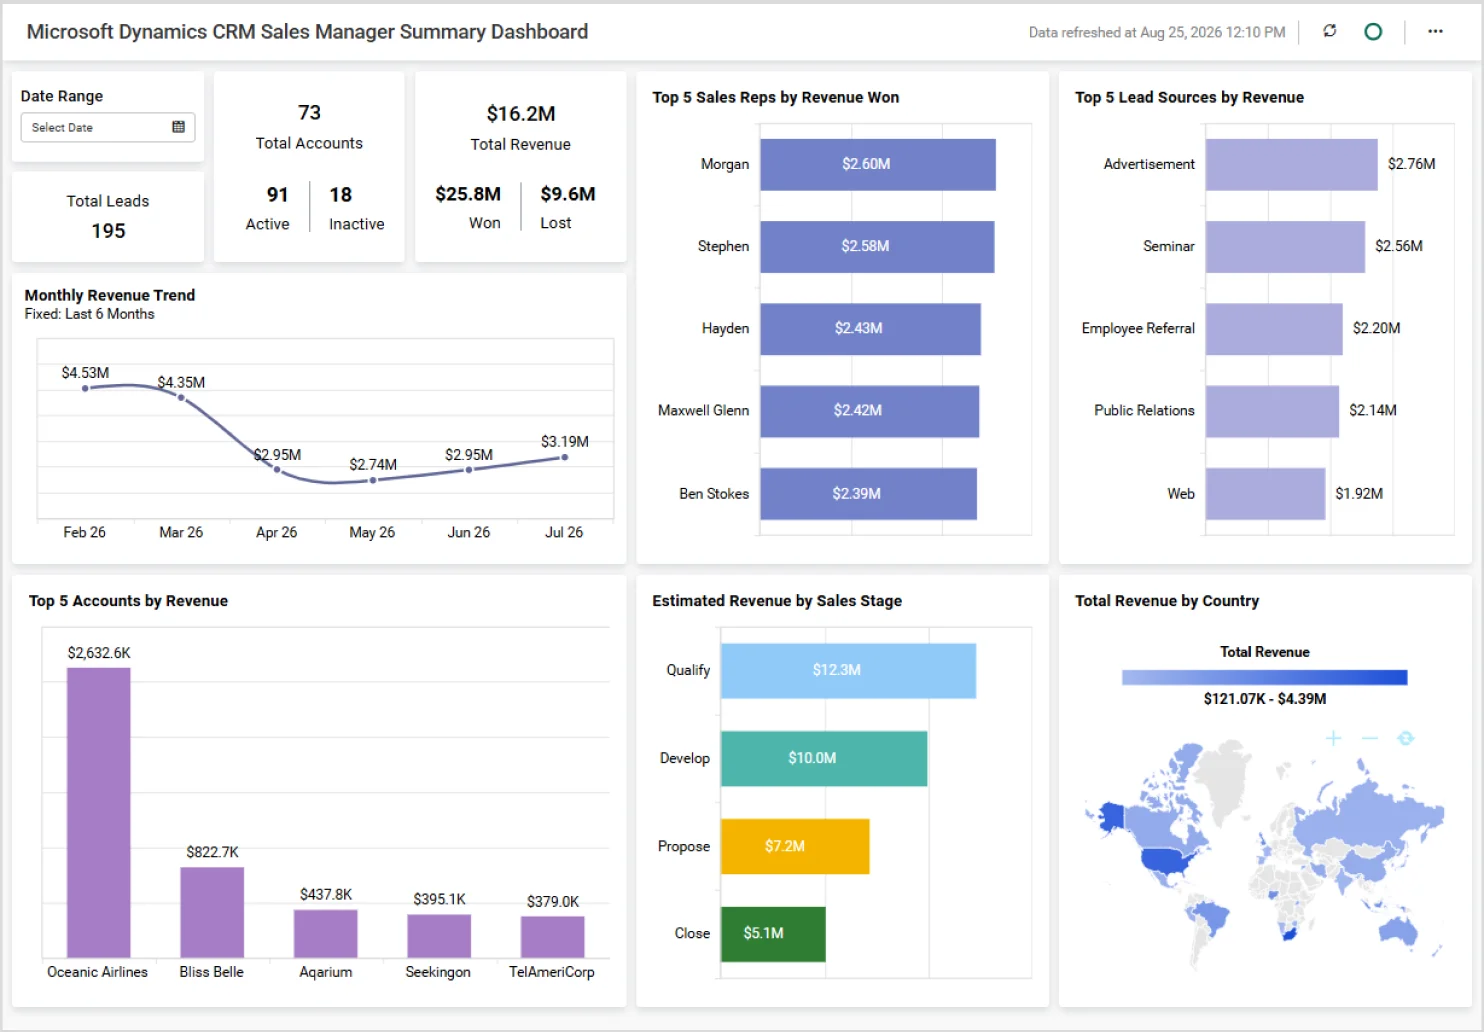
- Microsoft Dynamic CRM Sales Manager Summary Dashboard gives sales leaders visibility into team performance, pipeline health, quota attainment, and deal progress, helping them identify coaching opportunities and address risks before they impact revenue targets.
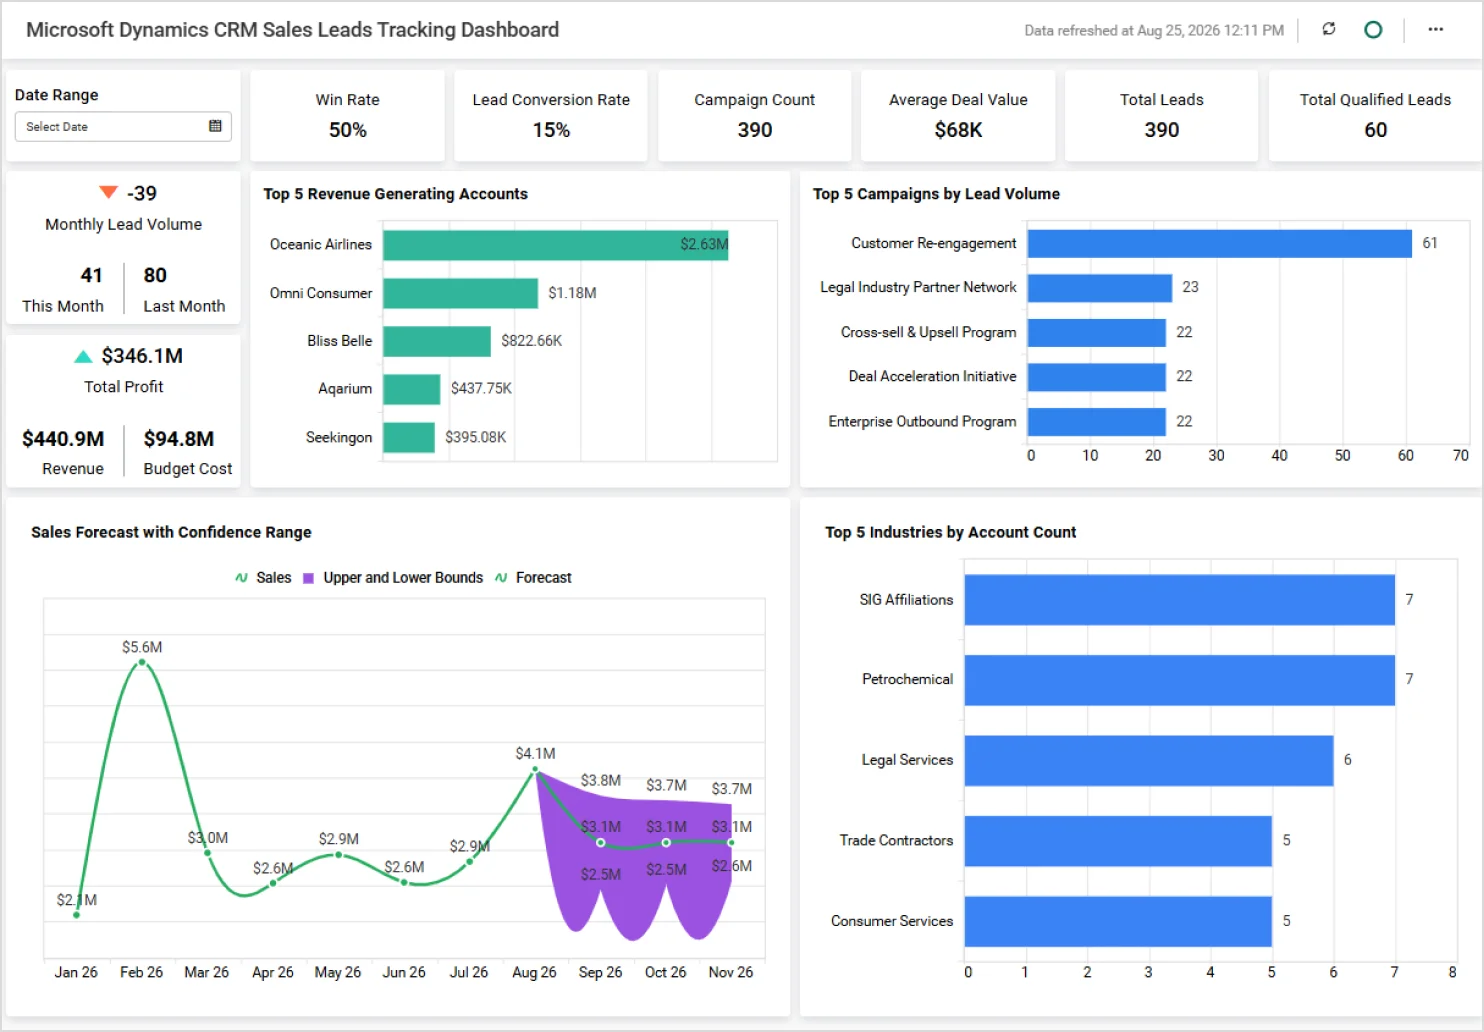
- Microsoft Dynamics CRM Sales Leads Tracking Dashboard surfaces which lead sources are converting at the highest rate, so teams can double down on driving revenue rather than splitting budget evenly across channels.
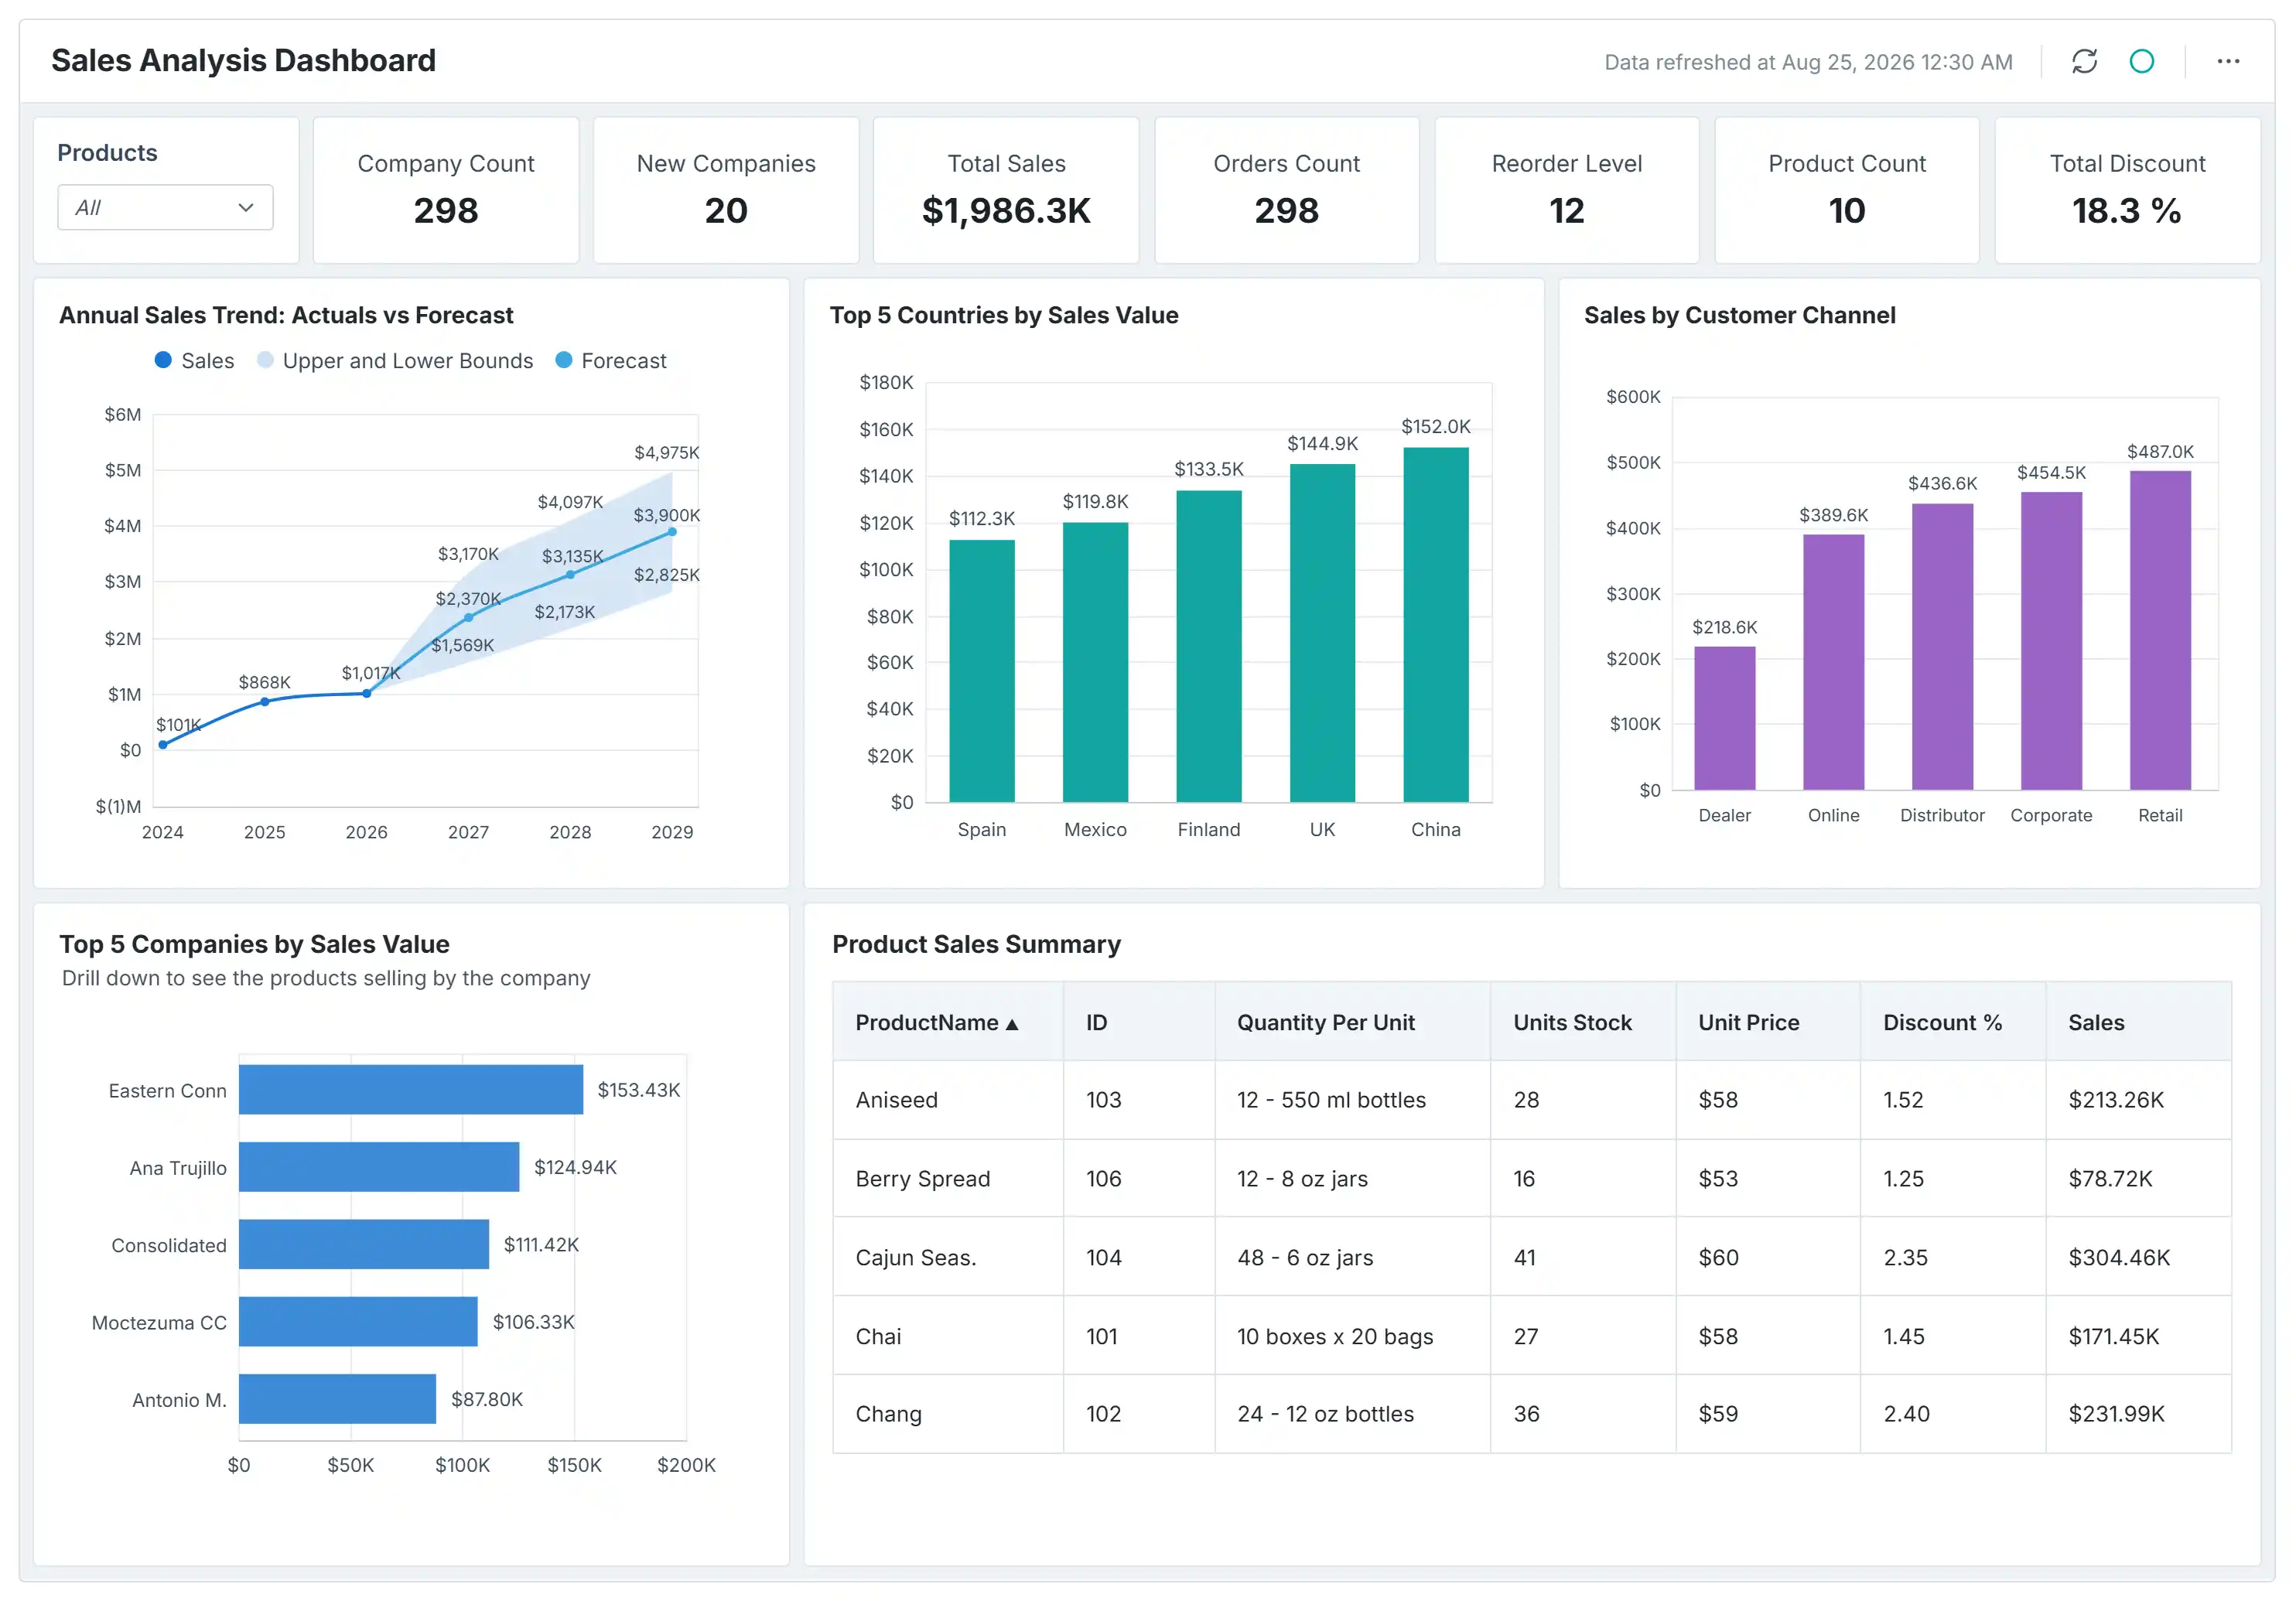
- Sales Analysis Dashboard helps identify which sales channels are most profitable versus just high-revenue, so leadership can prioritize margin, not just top-line growth, when allocating resources.
Subscription and Recurring Revenue Dashboards
Recurring revenue often provides a clearer picture of business health than one-time sales. These dashboards help SaaS organizations understand customer retention, subscription growth, and long-term revenue sustainability.
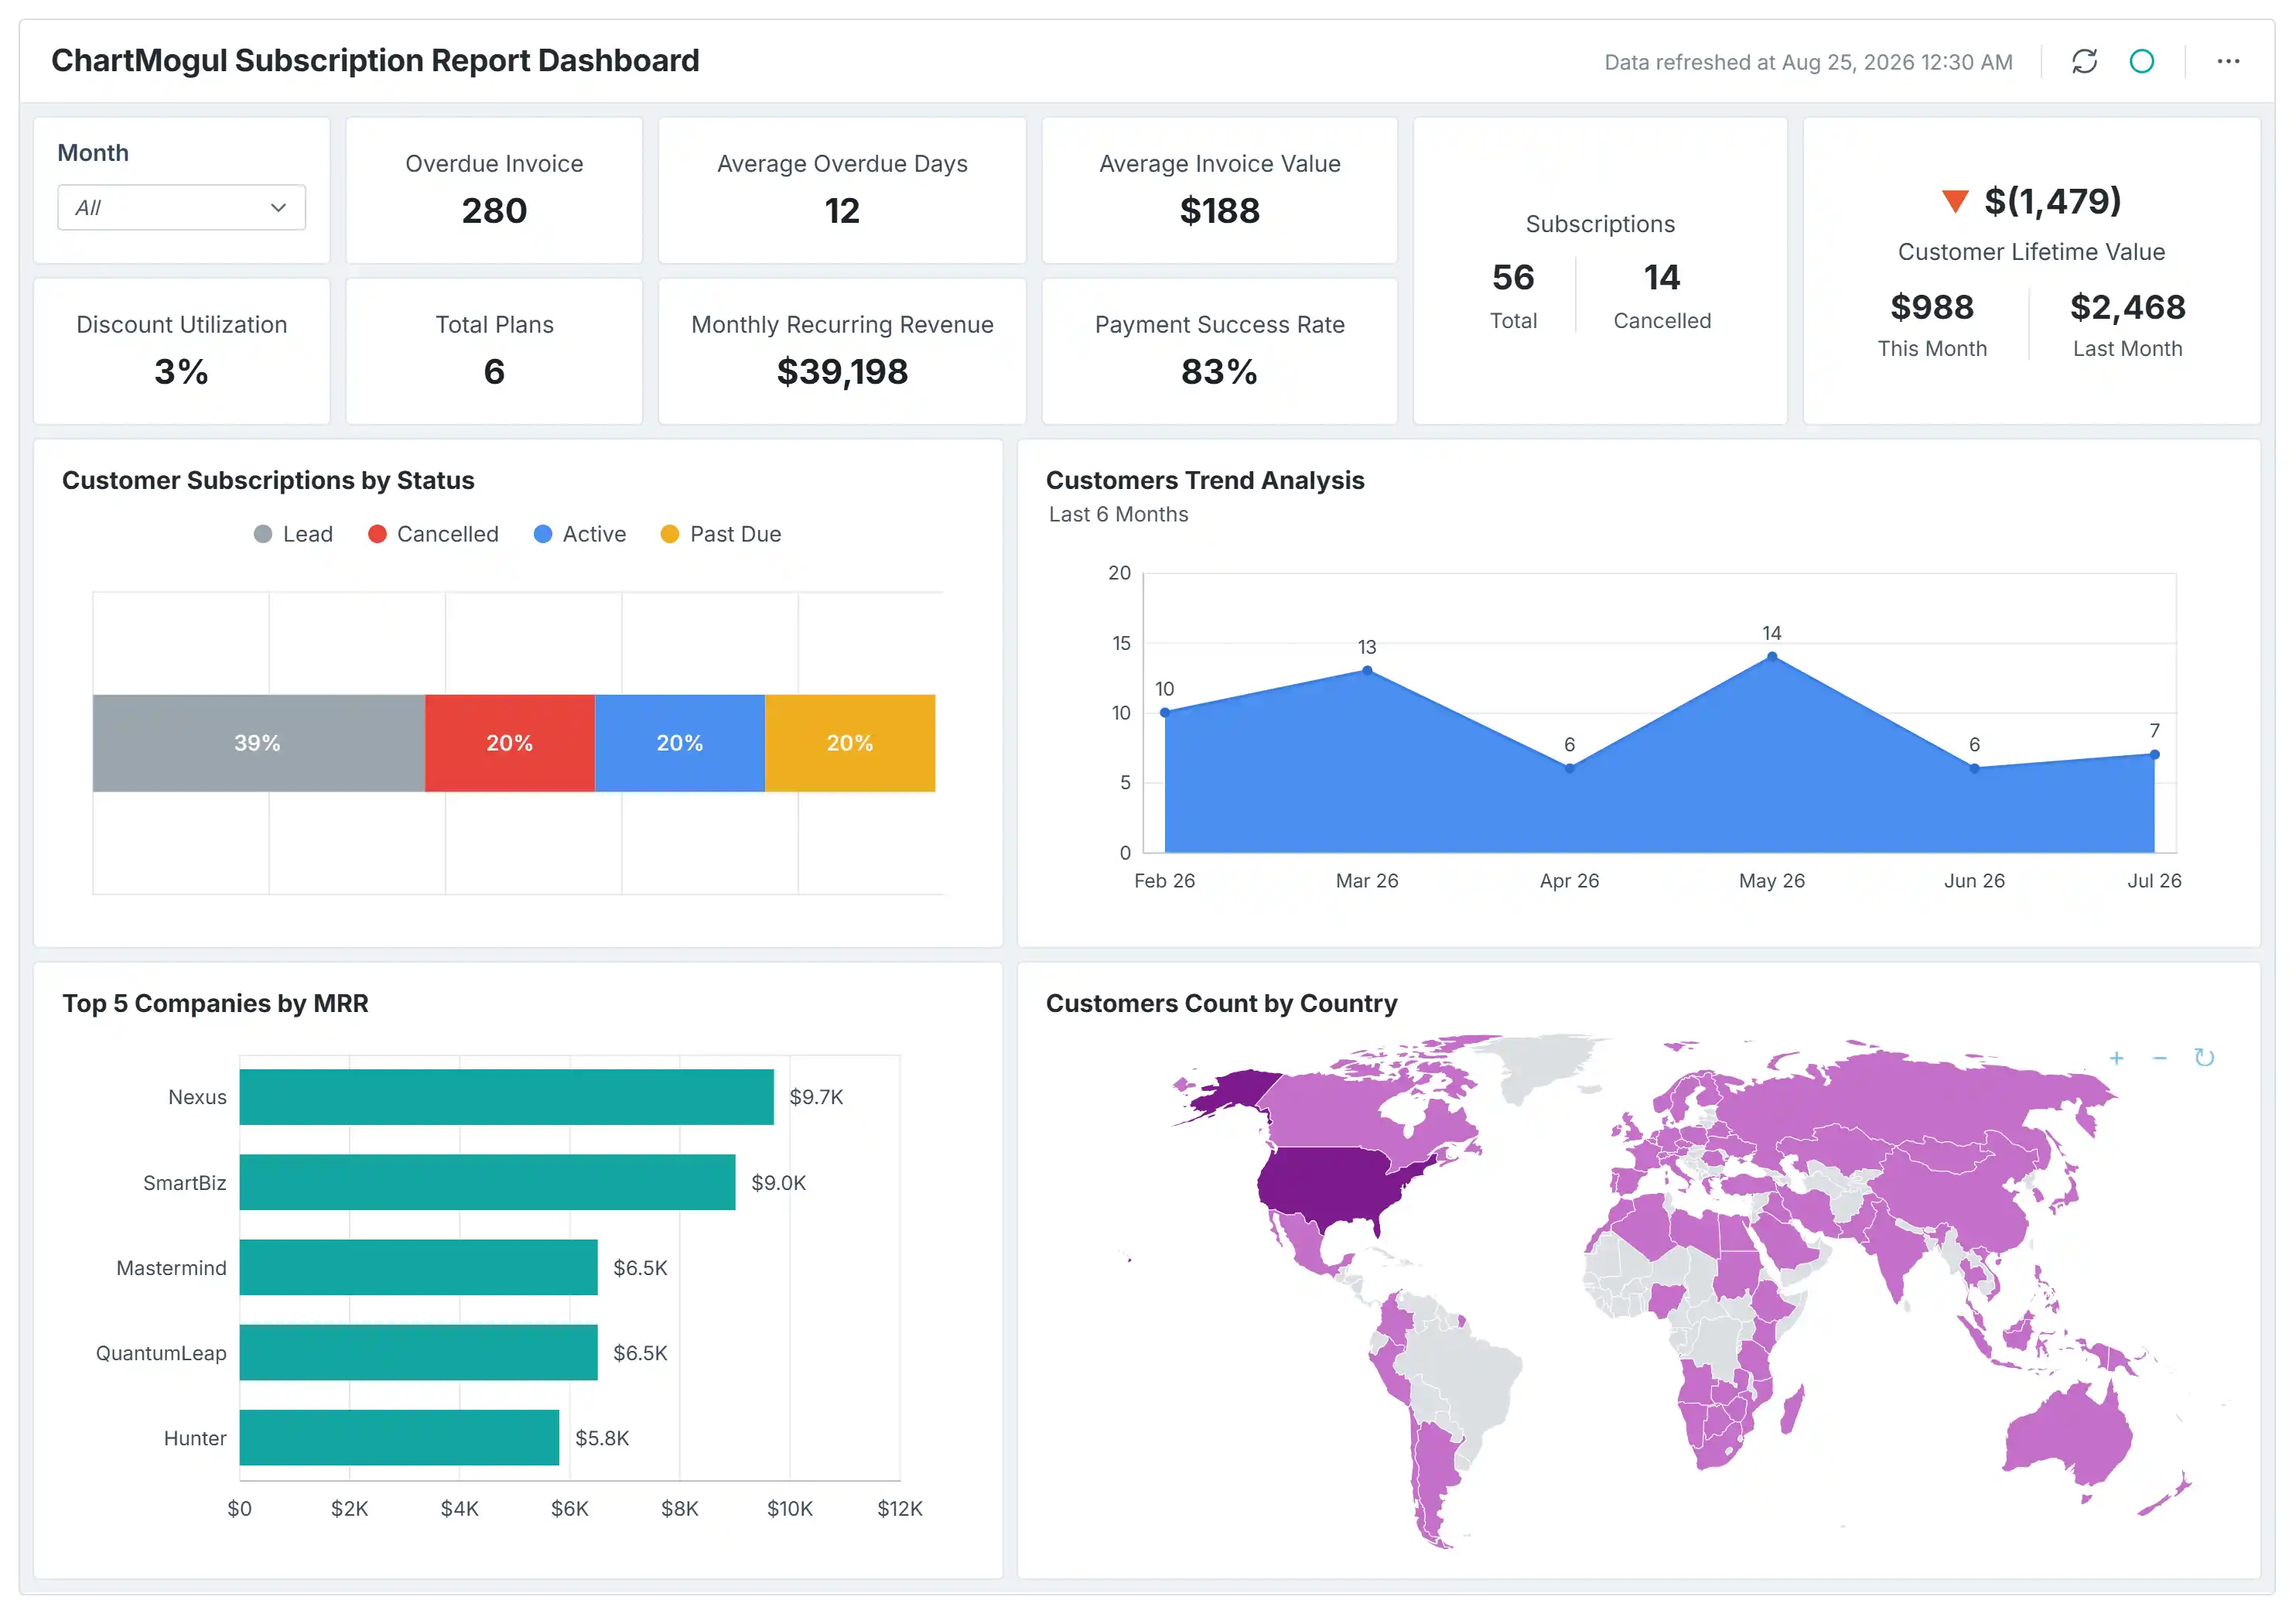
- ChartMogul Subscription Report Dashboard connects payment failures to subscription health, so RevOps can intervene on at-risk accounts before a failed payment turns into a churned customer.
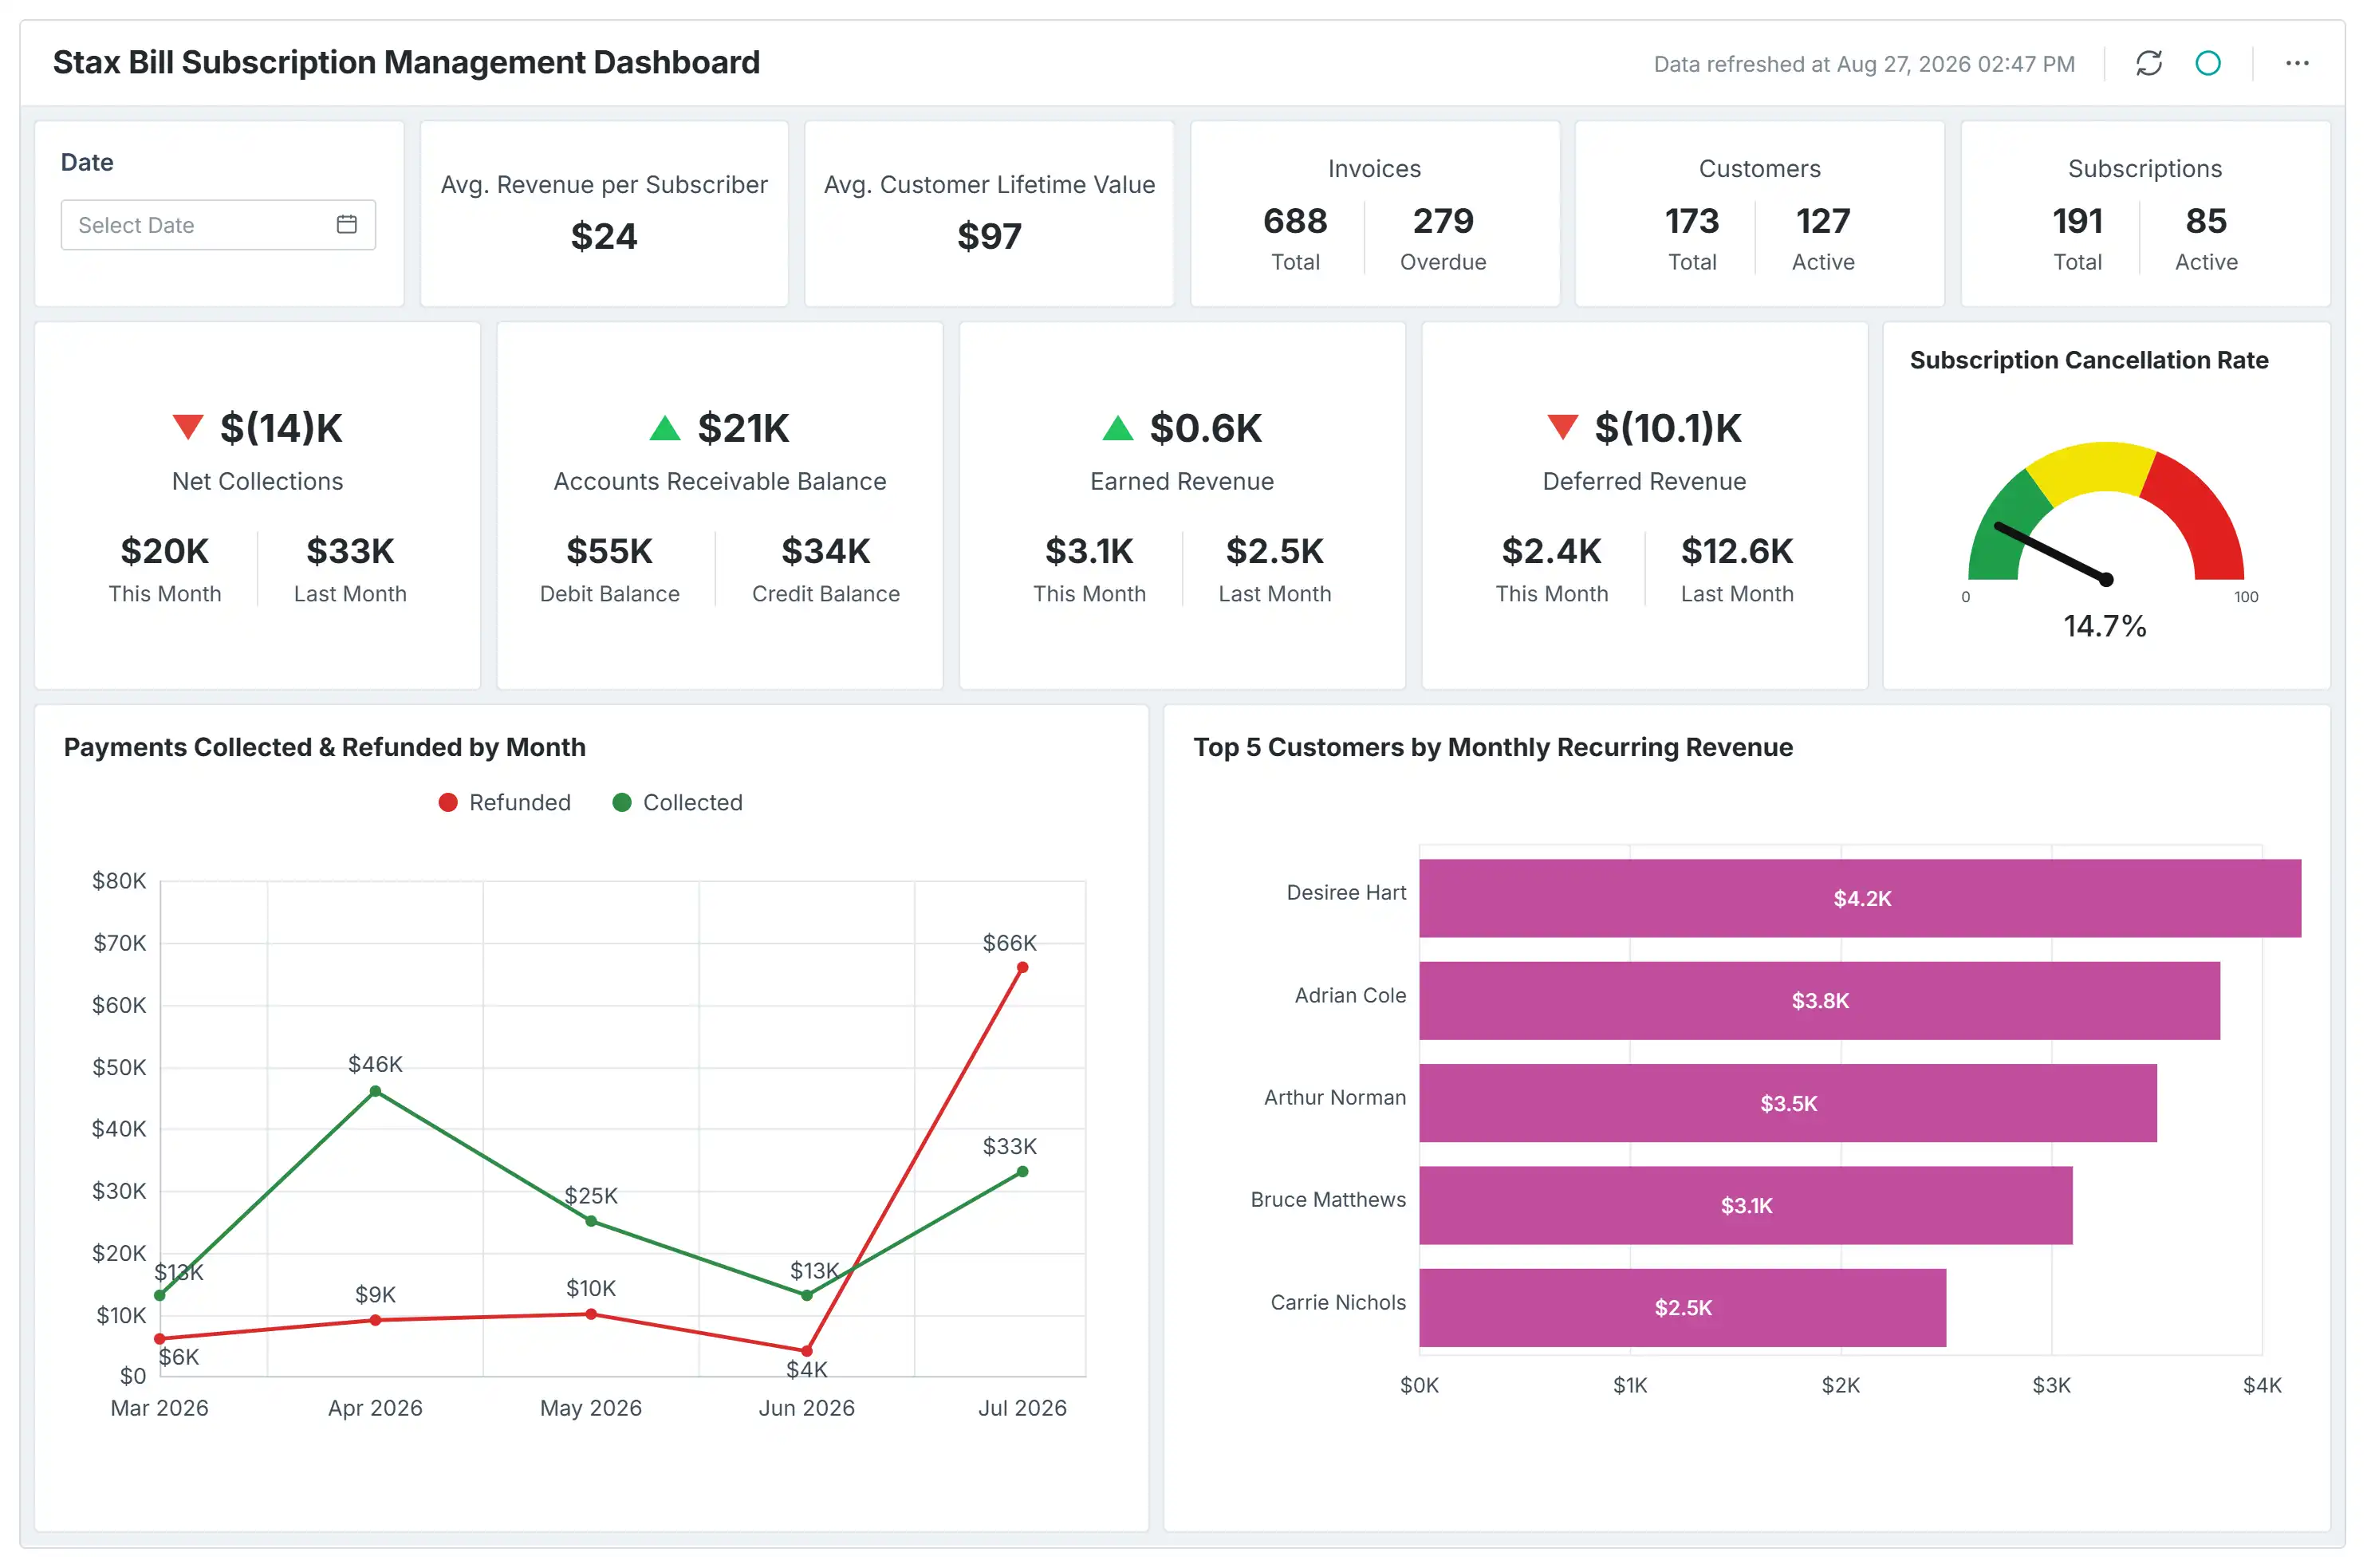
- Stax Bill Subscription Management Dashboard shows the gap between billed and collected revenue in real time, so finance can chase down collection issues before they become a cash-flow problem.
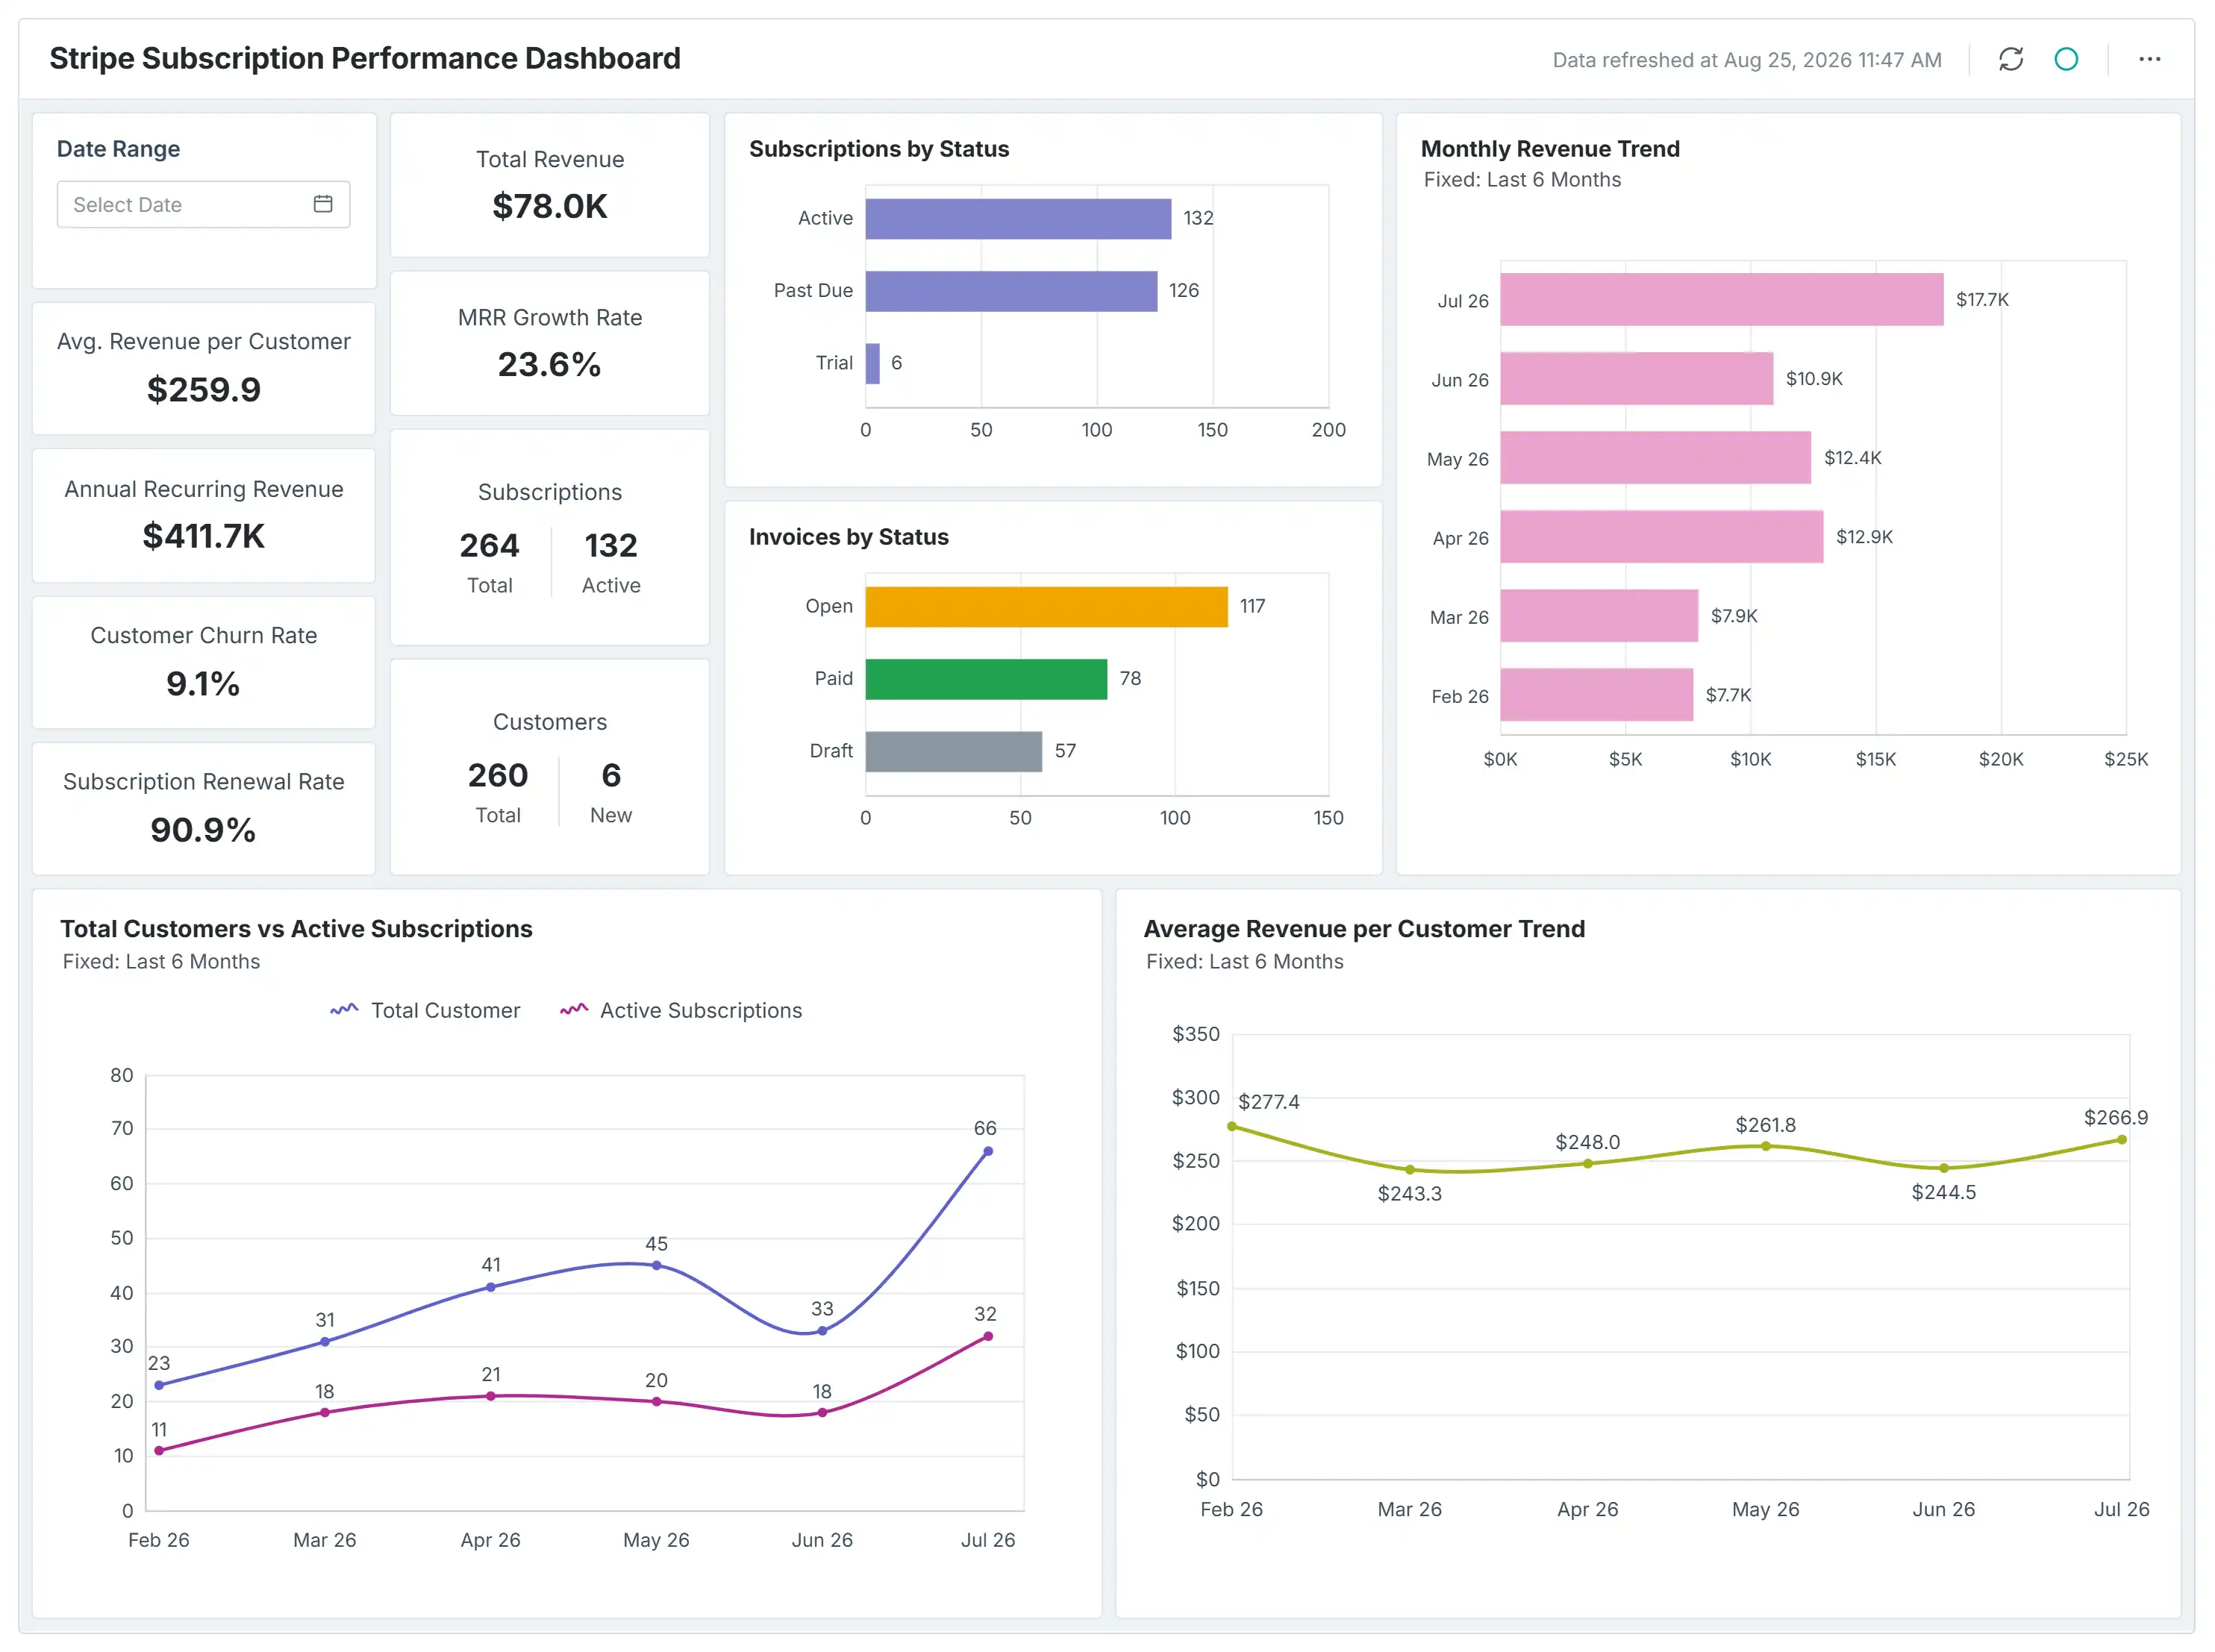
- Stripe Subscription Performance Dashboard flags a dip in renewal rate for a specific customer segment weeks before the quarterly review, so RevOps can trigger retention outreach while there’s still time to save the account.
Marketing Revenue Attribution Dashboards
Marketing teams are under increasing pressure to prove their contribution to business growth. While metrics such as clicks, impressions, and website visits are useful, executives ultimately want to know how marketing efforts influence revenue. Marketing revenue dashboards bridge this gap by connecting campaign performance directly to business outcomes.
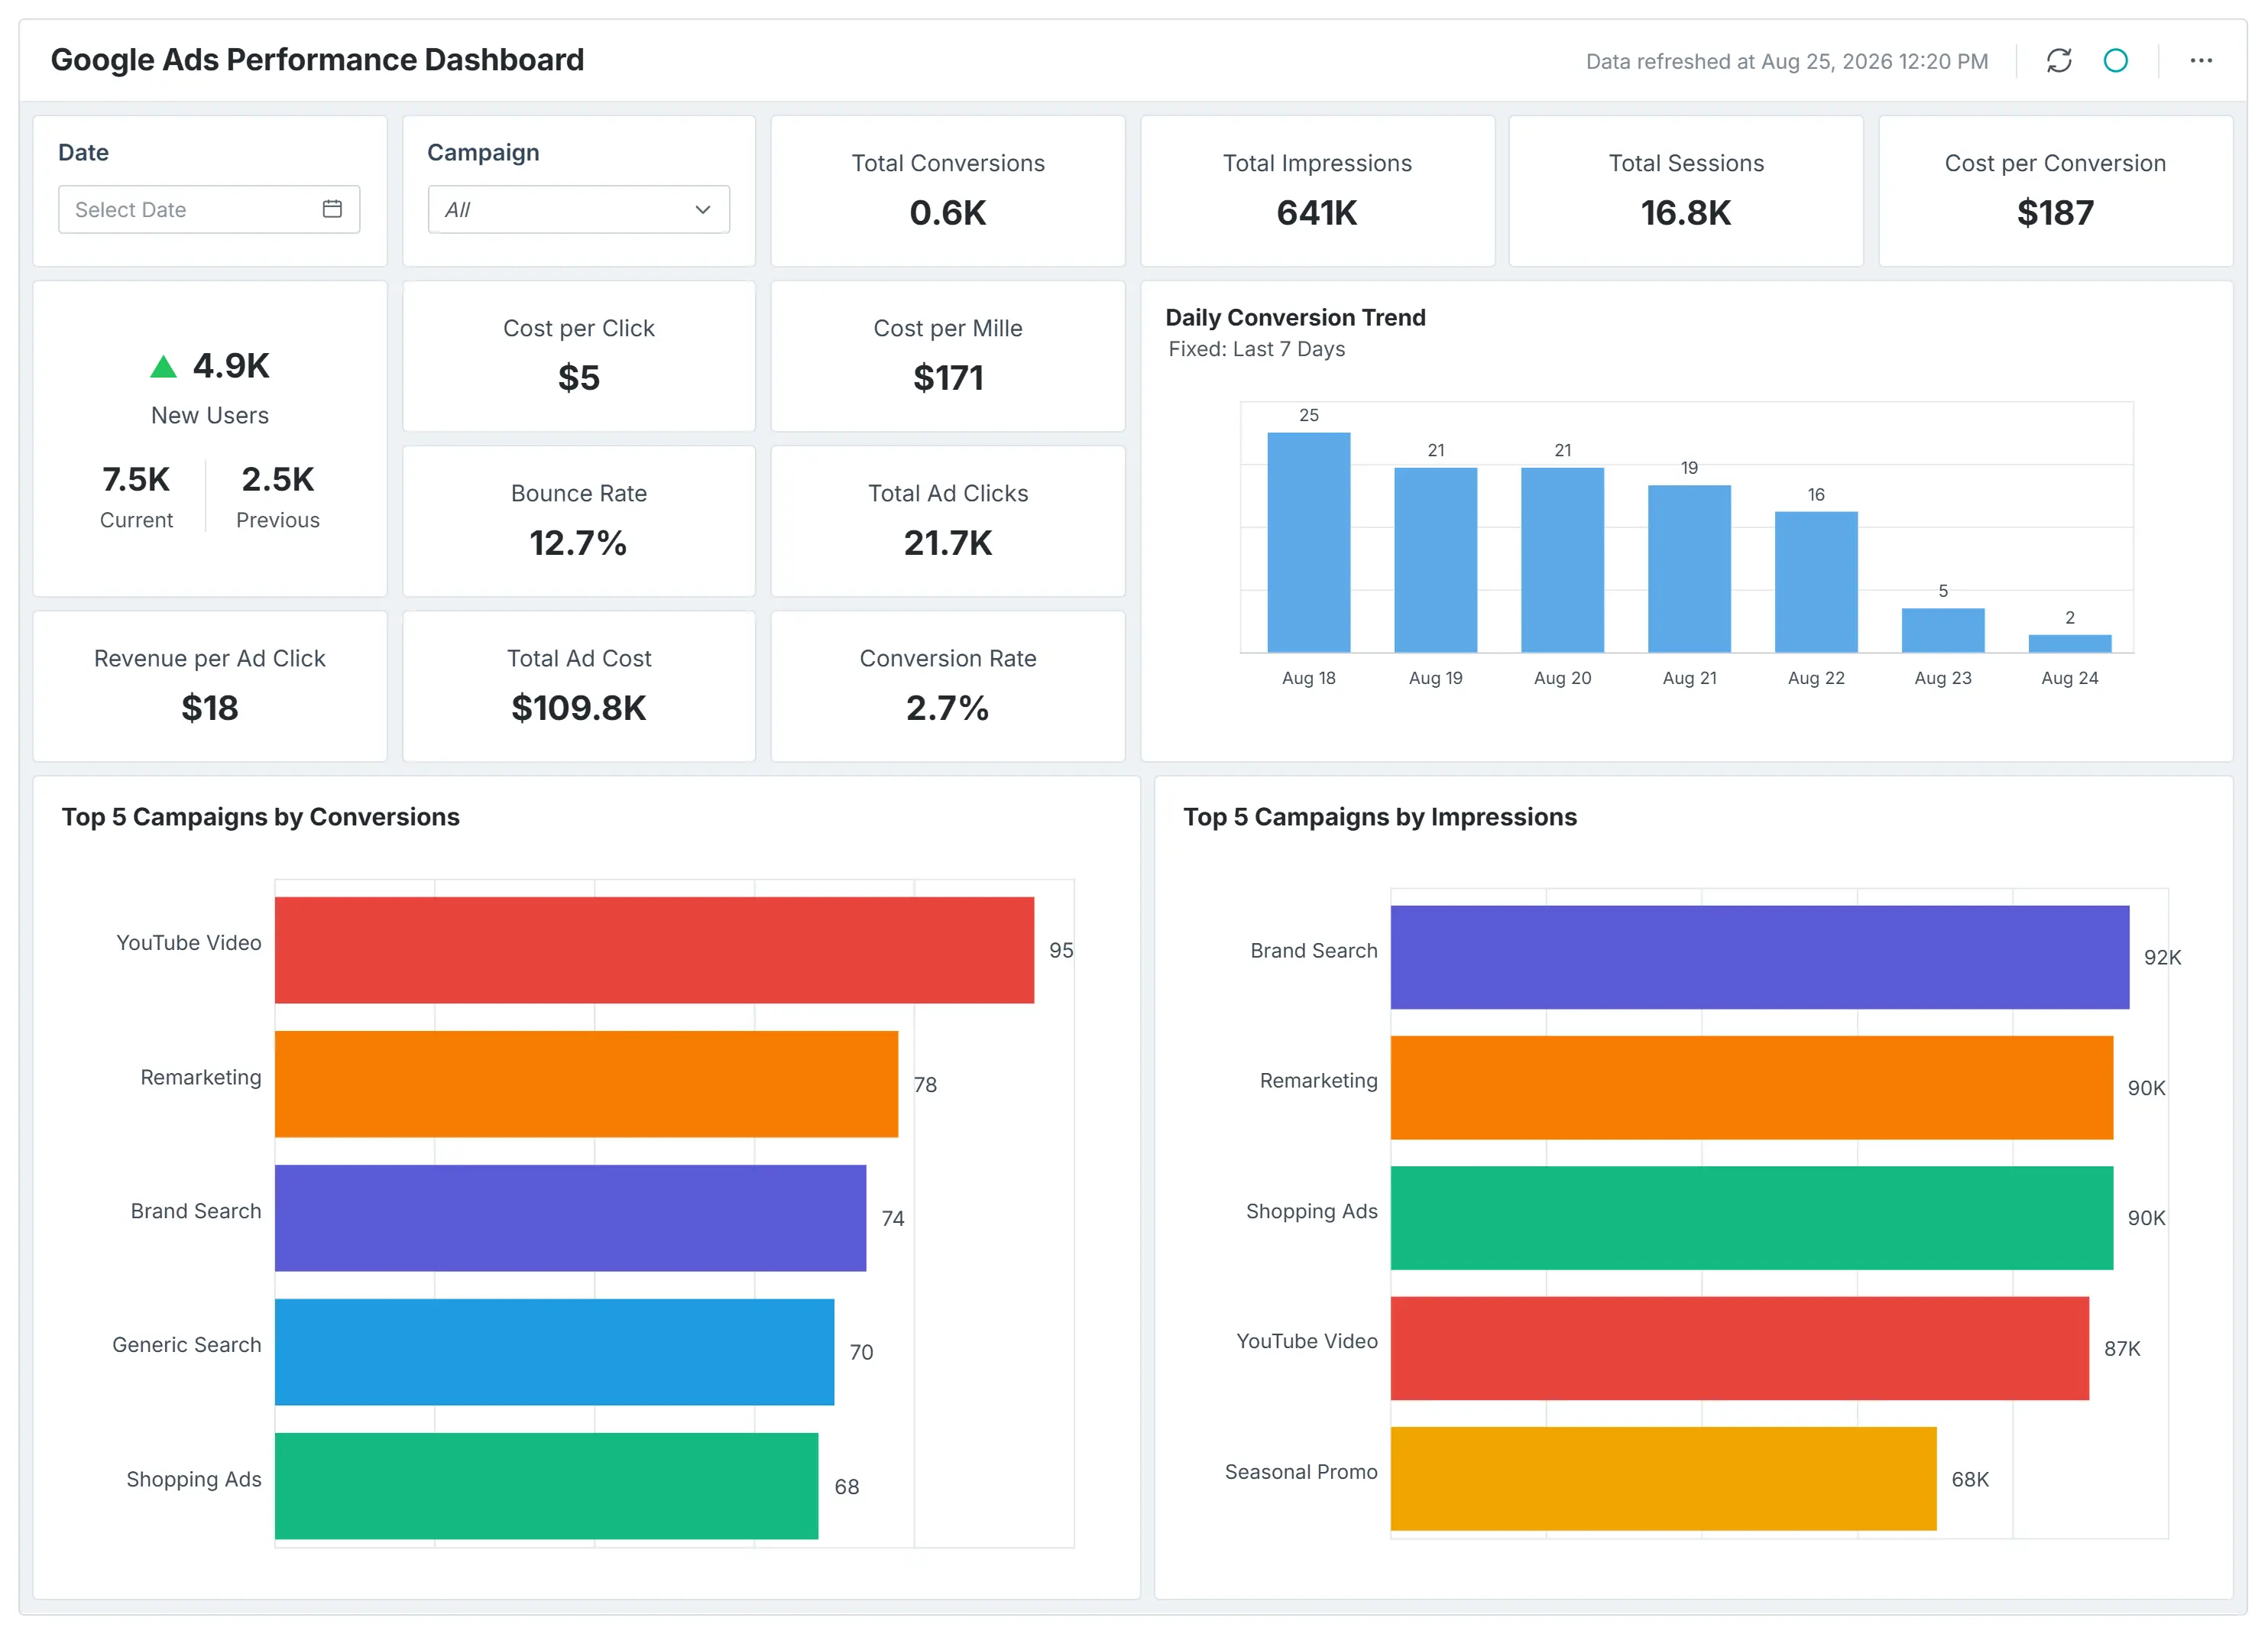
- Google Ads Performance Dashboard connects ad spend directly to closed revenue, not just clicks, so marketing can defend budget with dollars generated instead of impressions delivered.
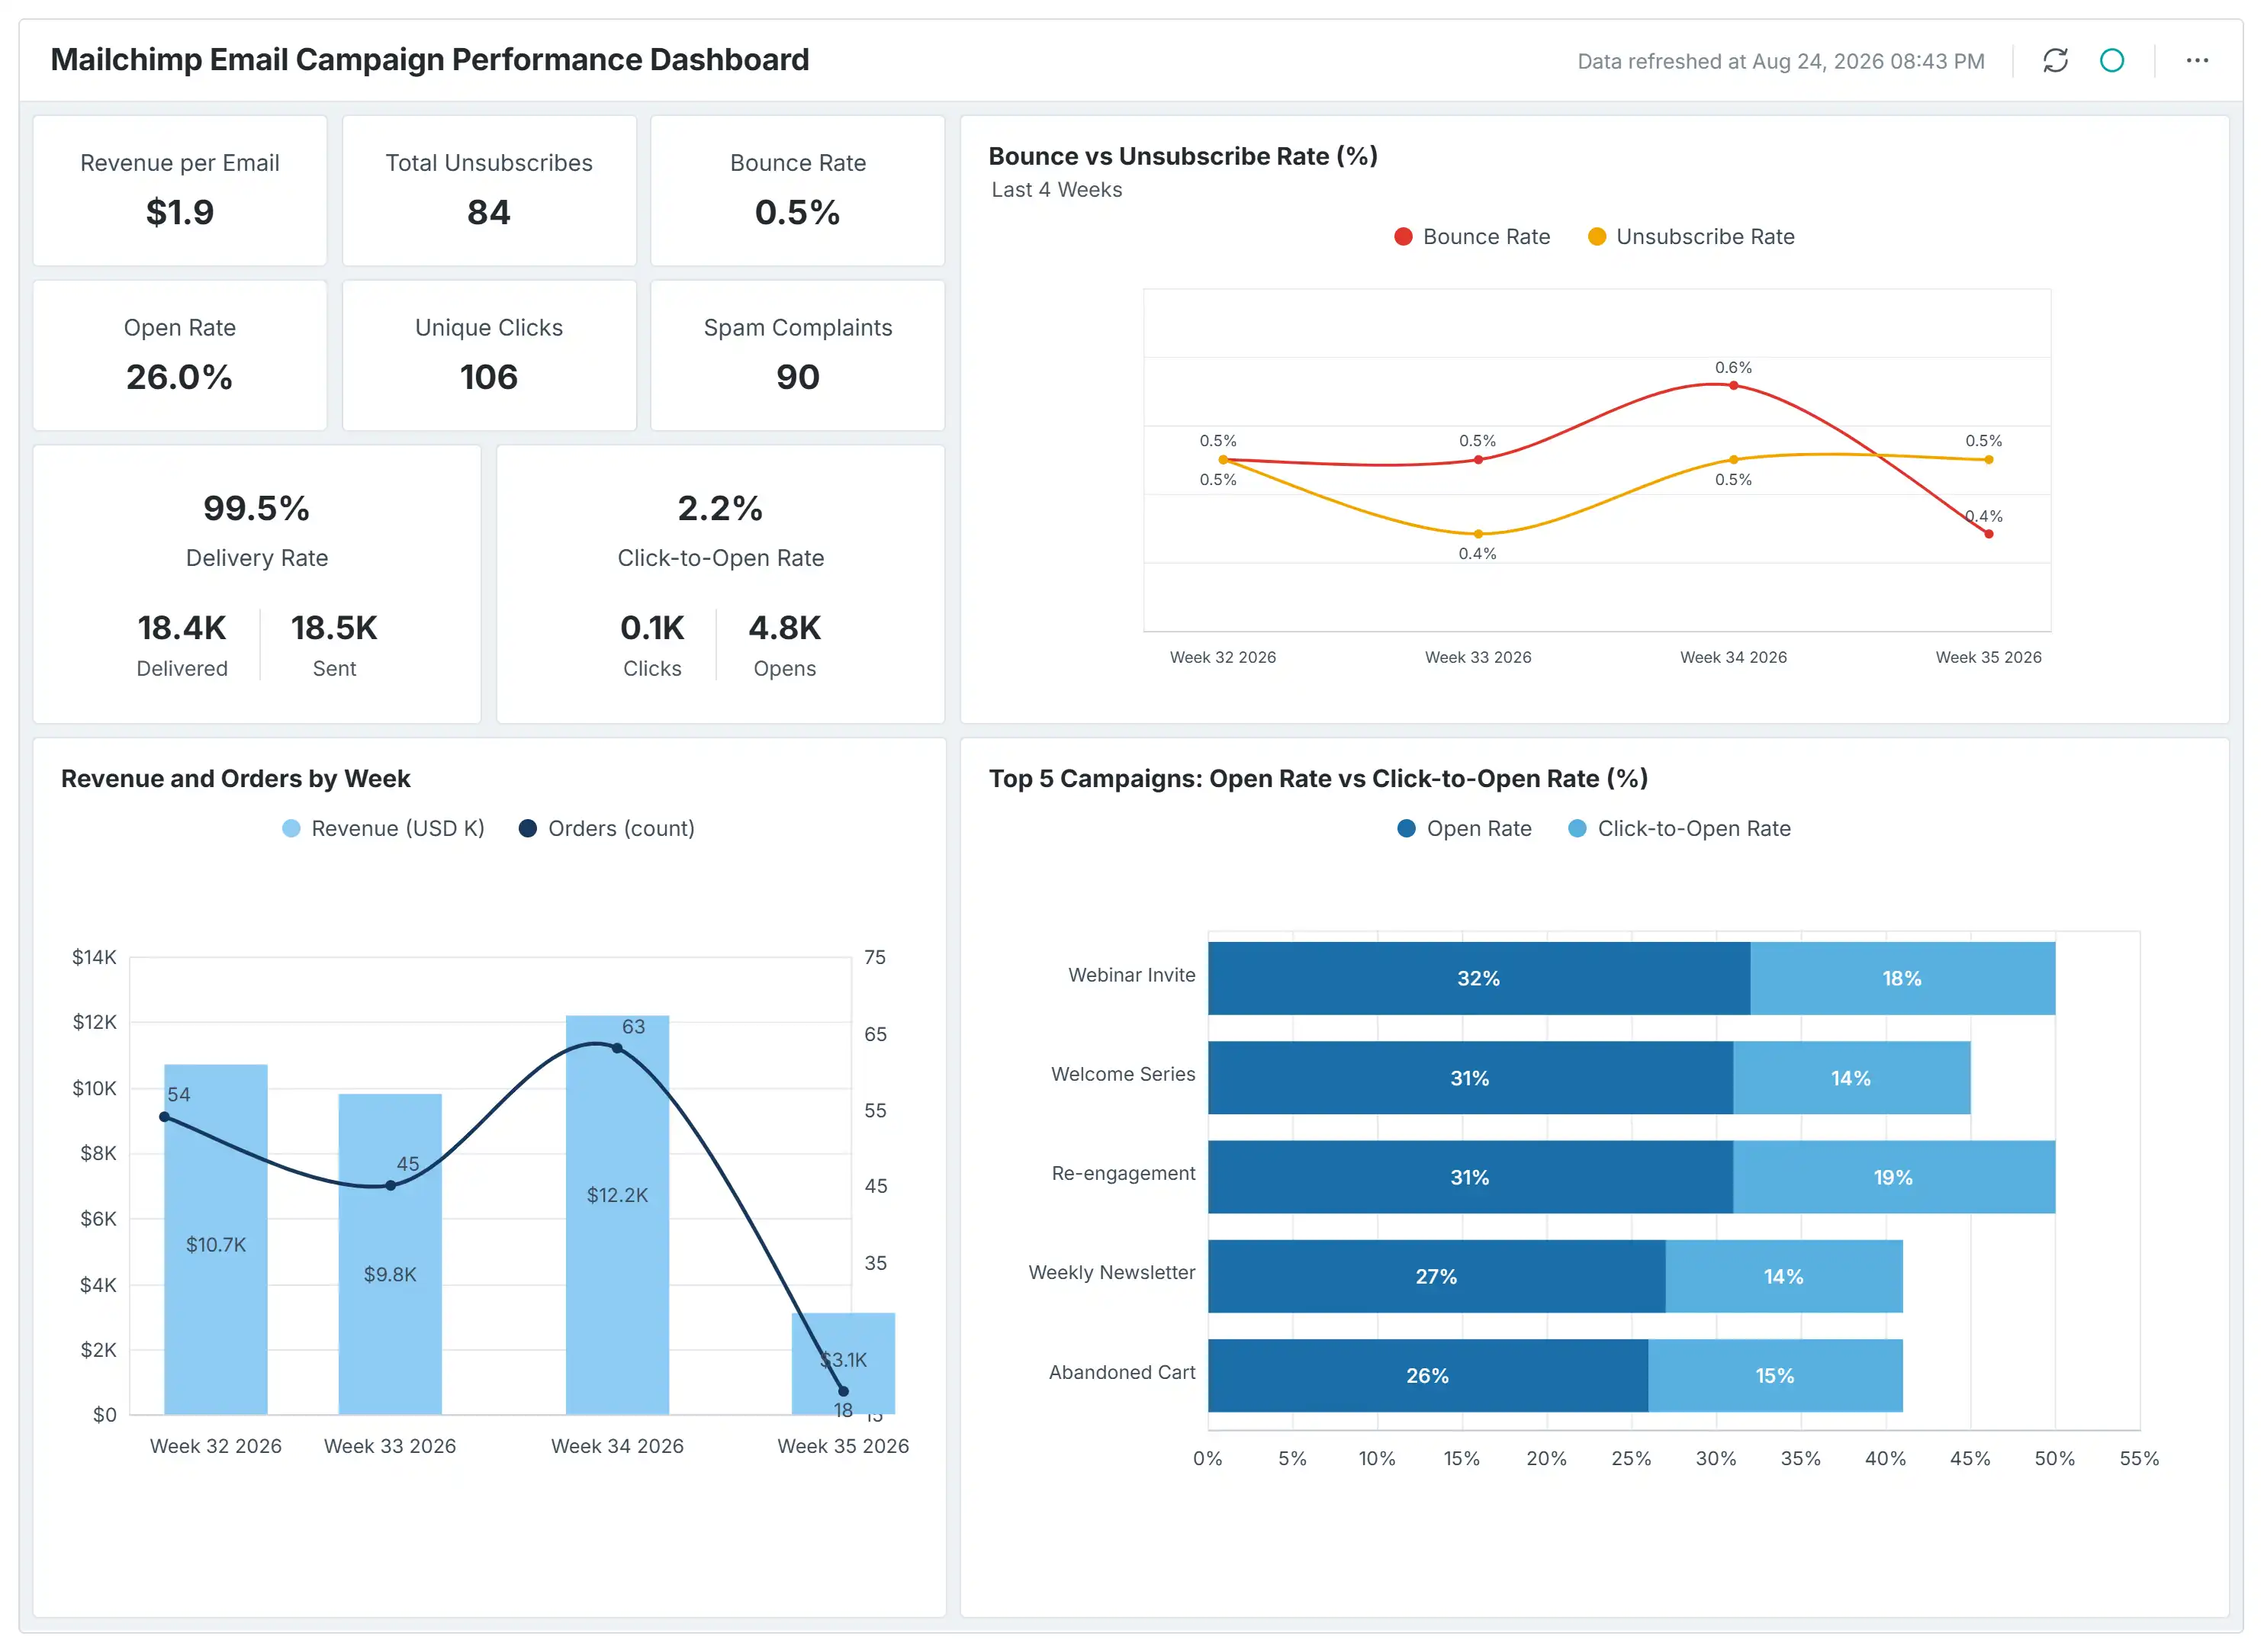
- Mailchimp Email Campaign Performance Dashboard helps identify which email campaigns contributed most to revenue generation versus just opens, so teams can stop optimizing engagement metrics that don’t move the business.
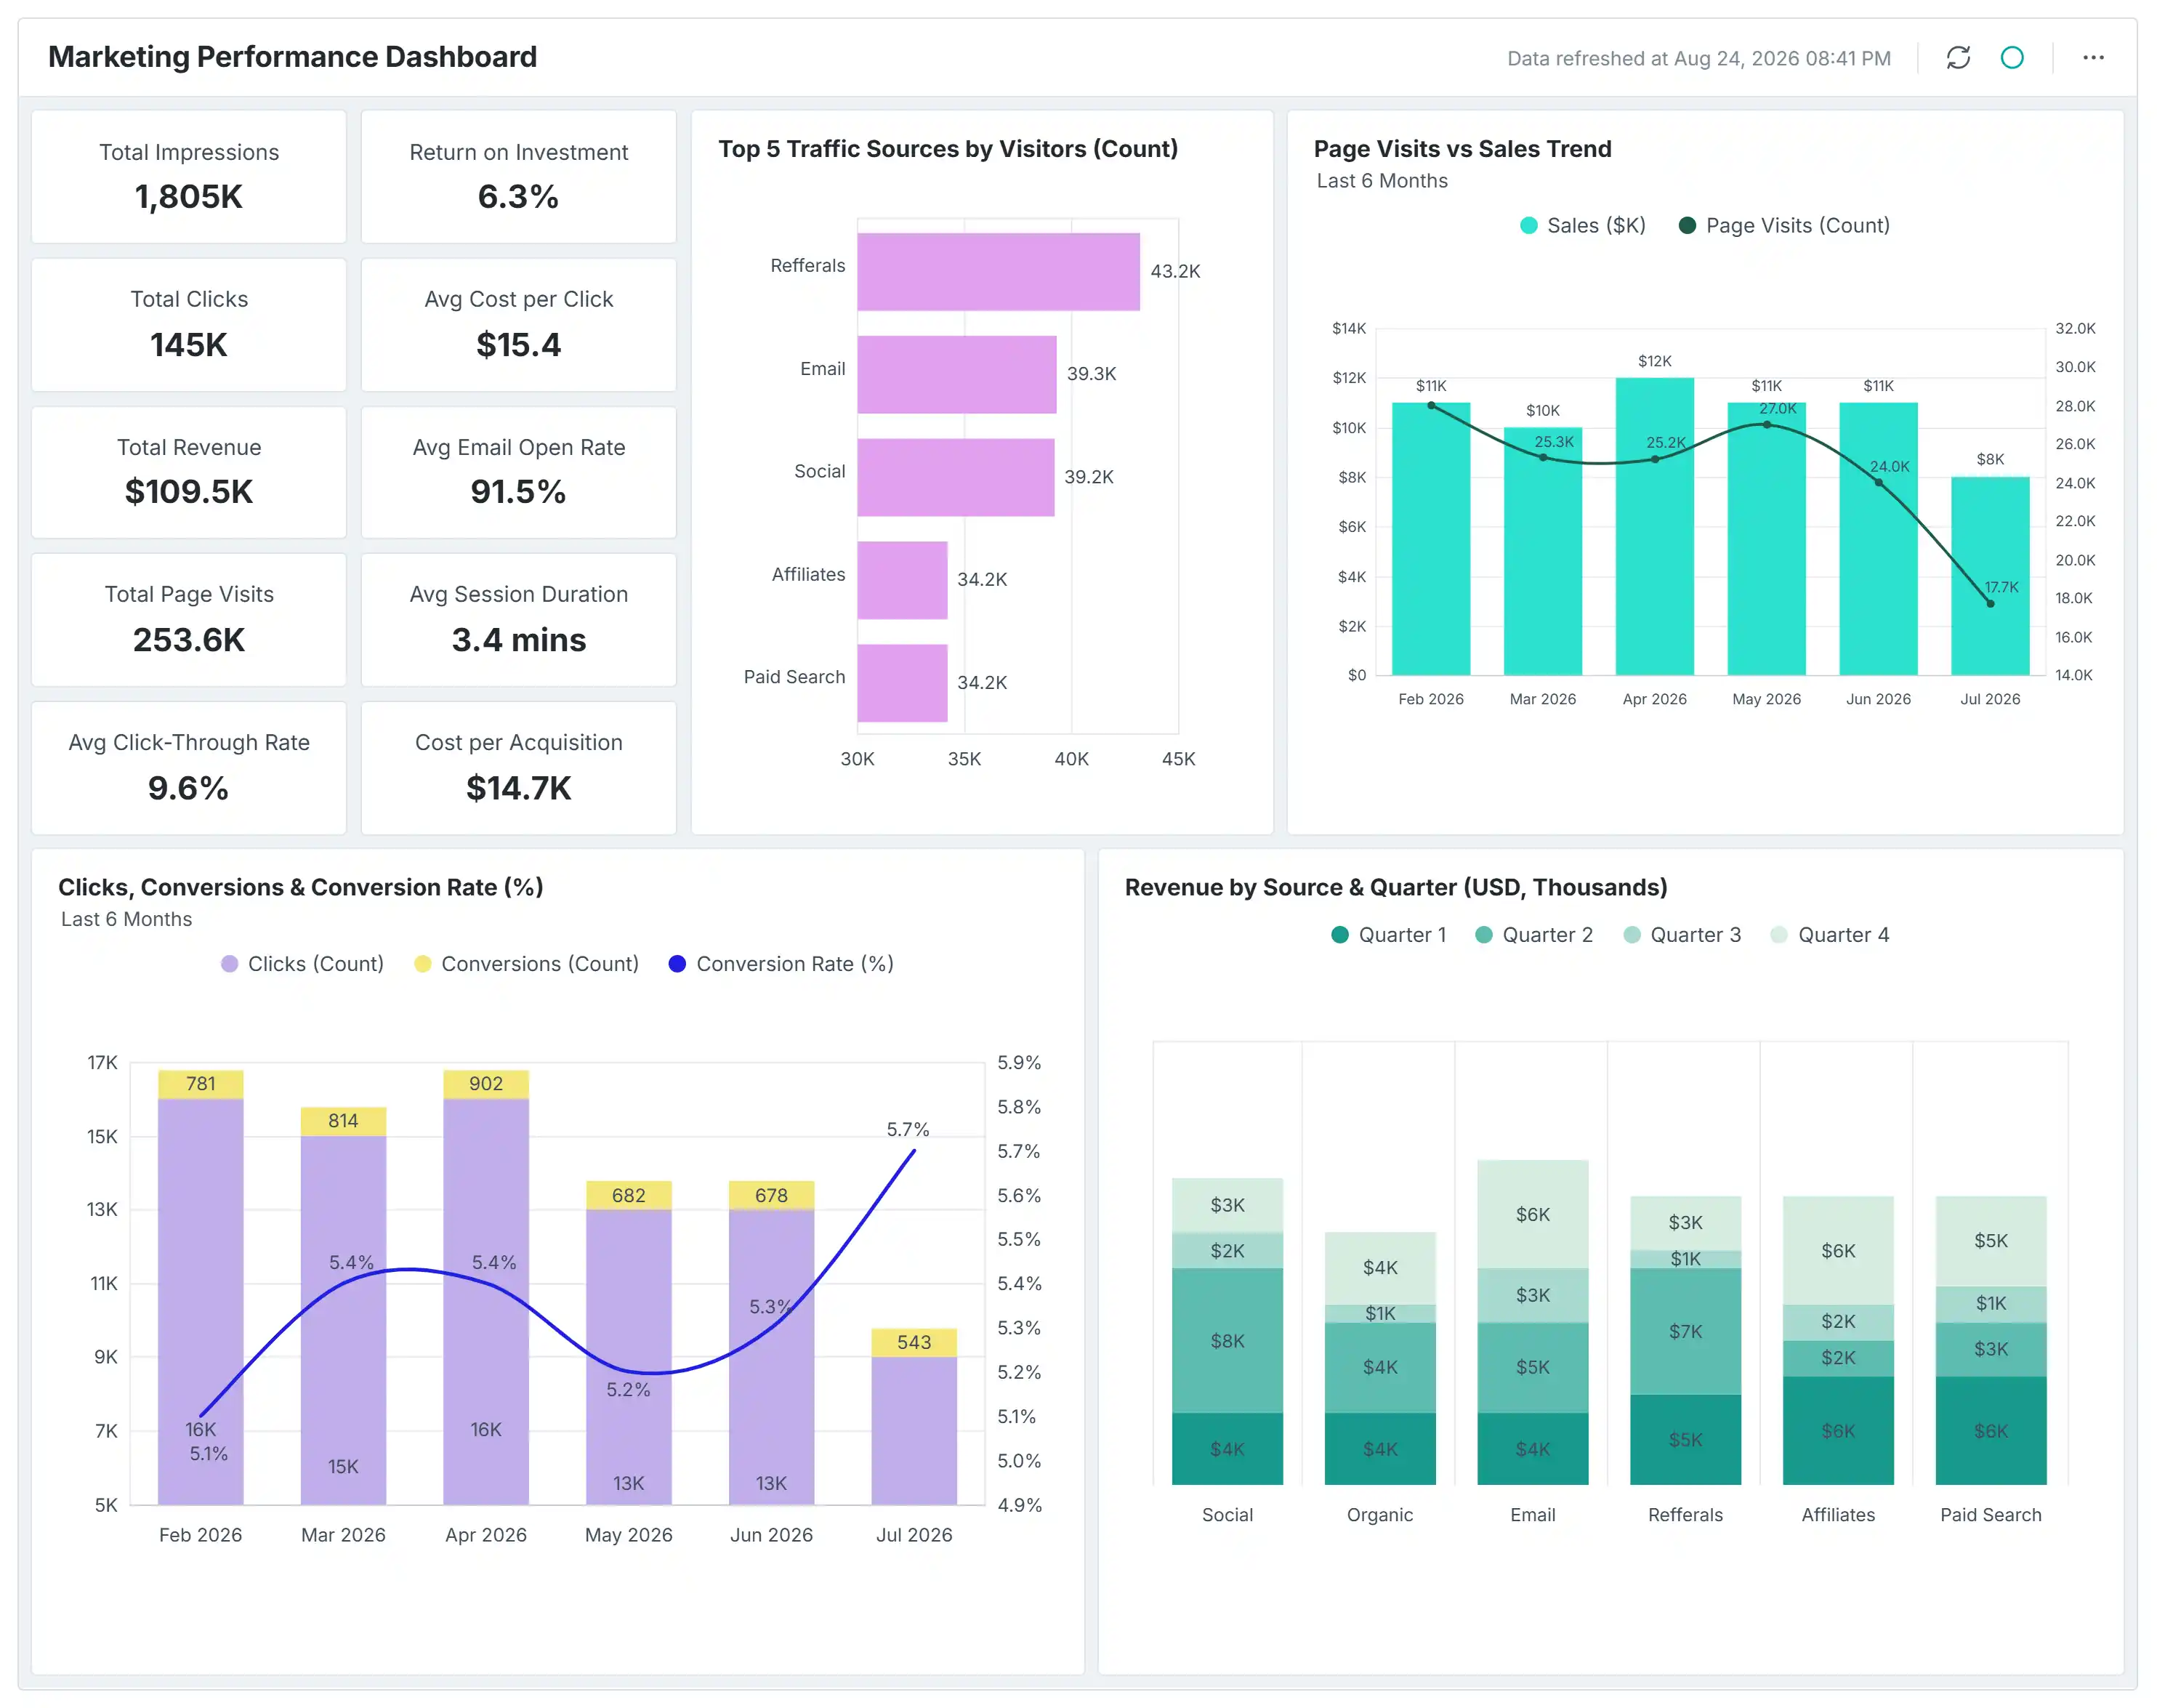
- Marketing Performance Dashboard helps identify which channels are delivering stronger ROI, so budget can be reallocated before the next planning cycle.
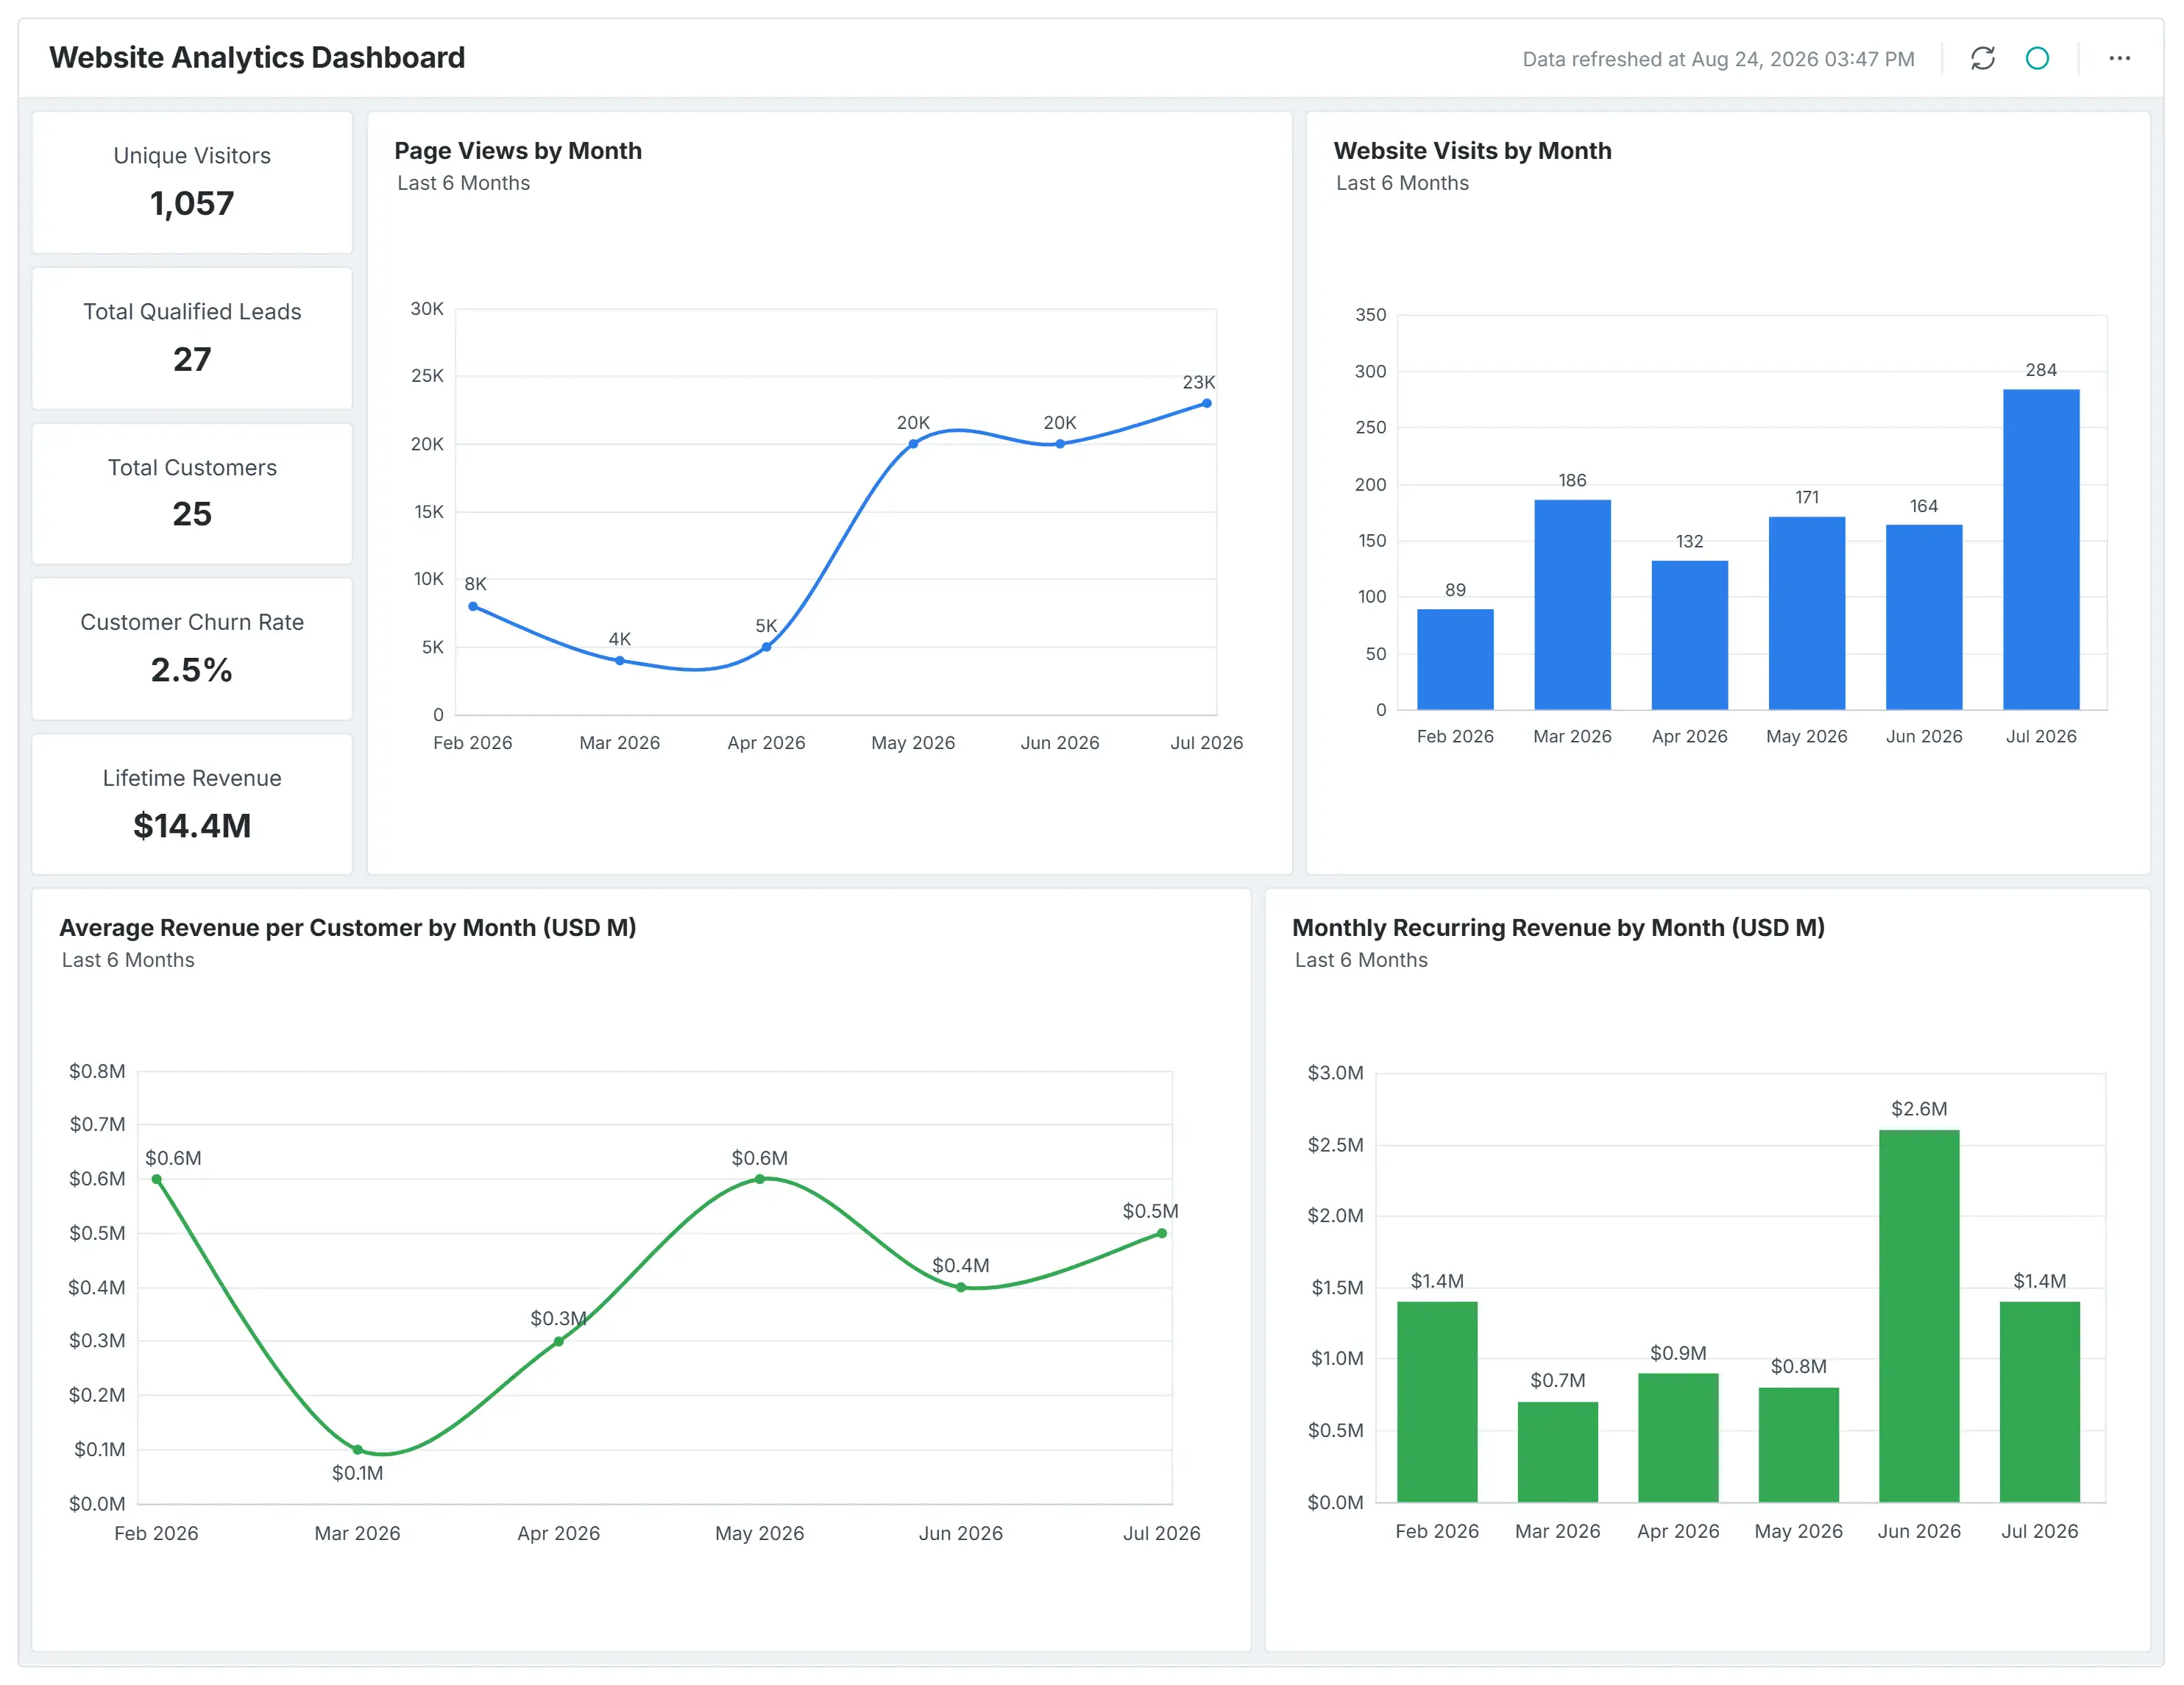
- Website Analytics Dashboard connects website traffic to downstream revenue, so teams can tell which visitors are worth the acquisition spend and which are just adding to a vanity traffic number.
Financial Revenue Dashboards
Revenue growth is important, but sustainable growth requires understanding profitability, expenses, budgets, and financial performance. Financial revenue dashboards help organizations connect top-line growth with bottom-line results.
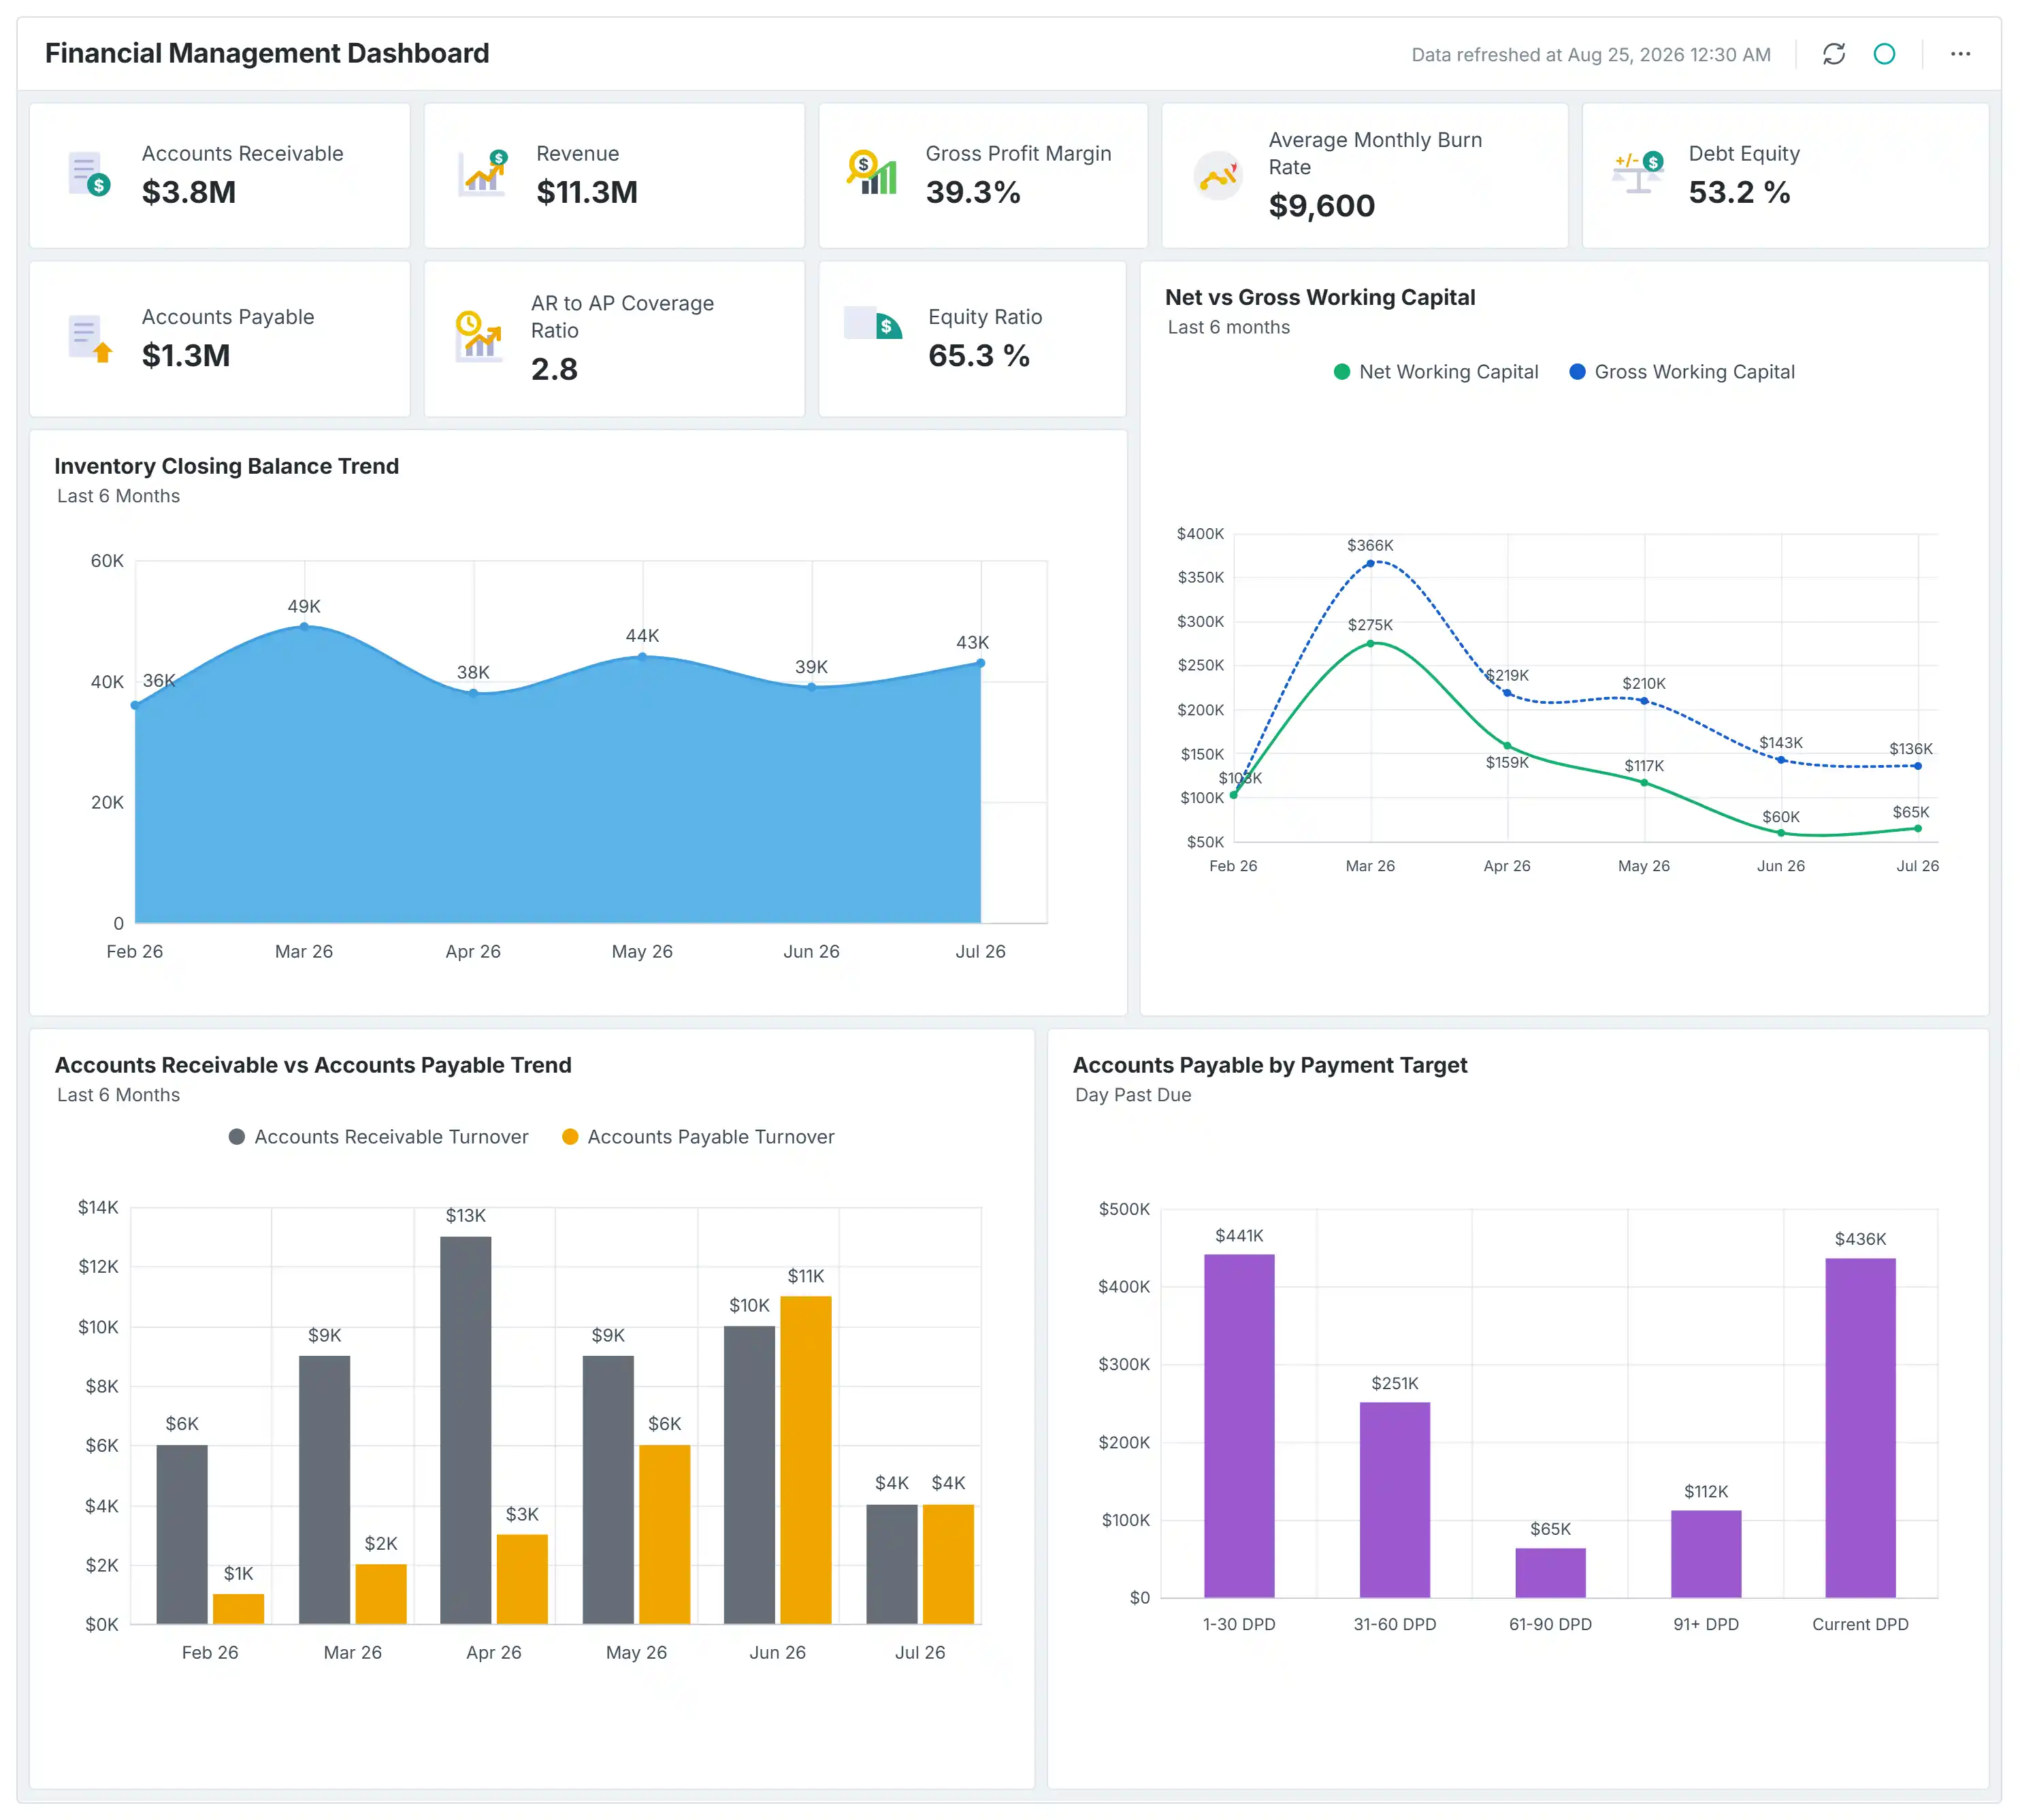
- Financial Management Dashboard surfaces a liquidity risk, such as receivables outpacing cash on hand, early enough for leadership to act instead of discovering it during month-end close.
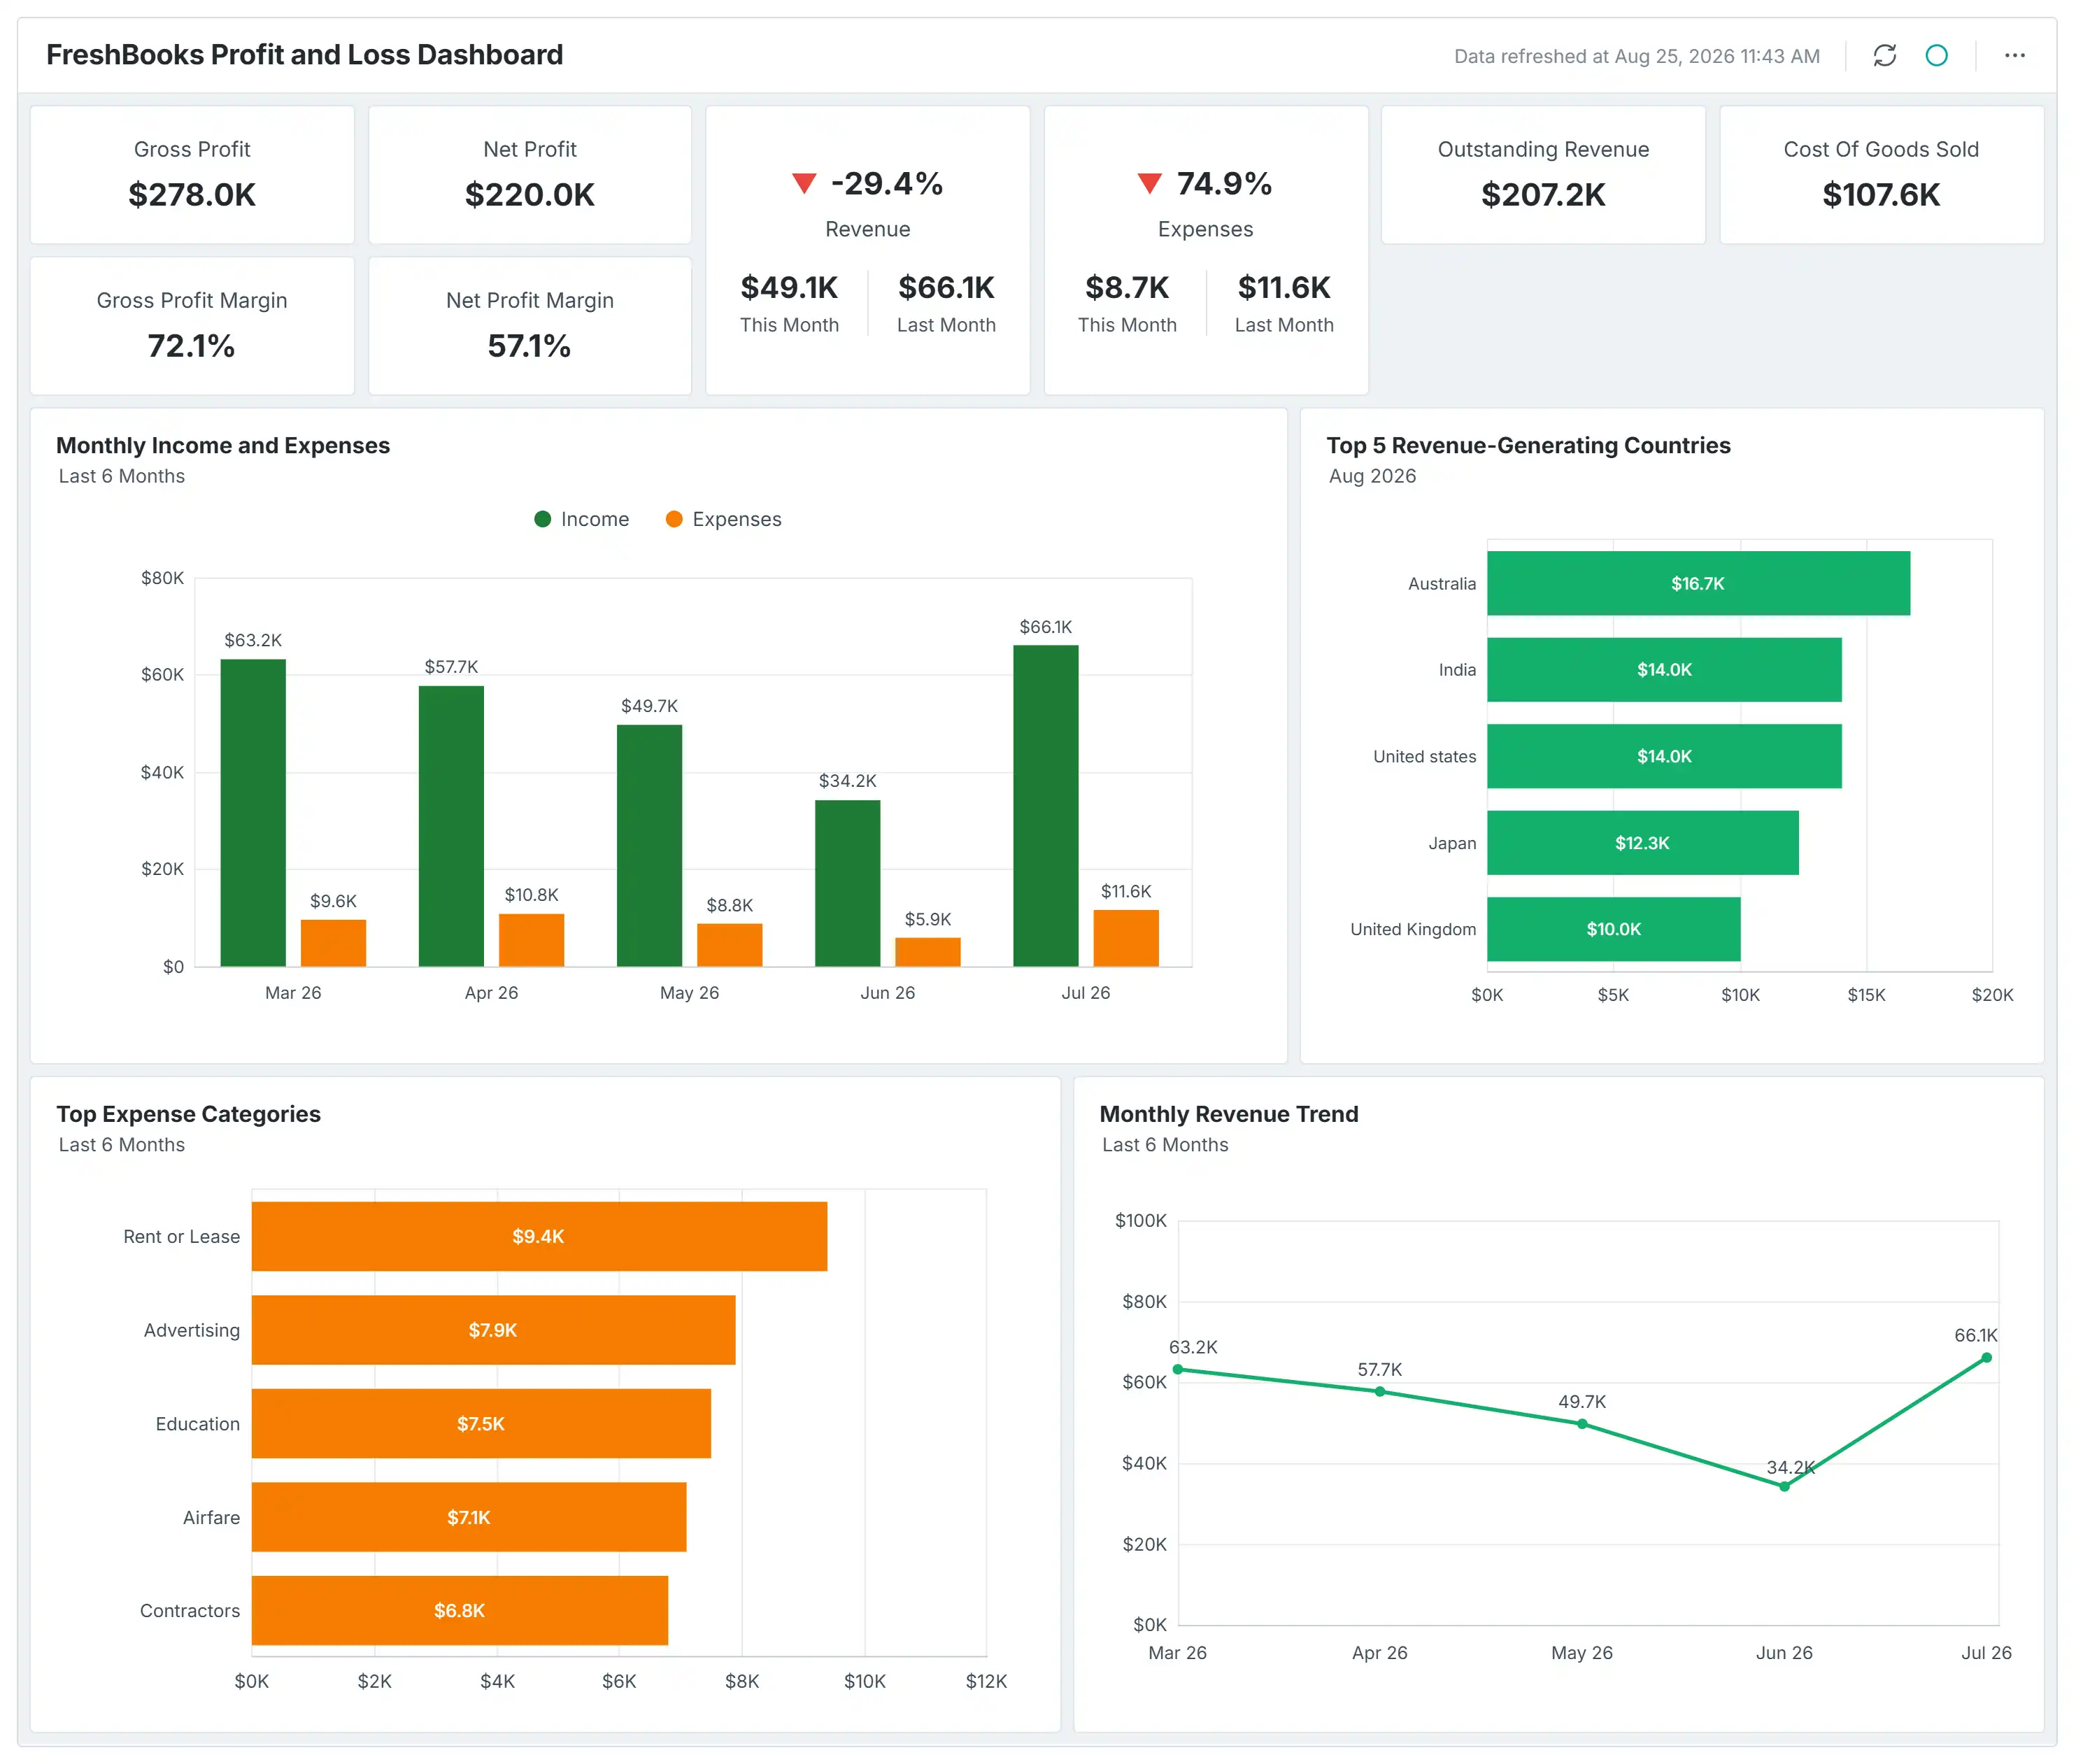
- FreshBooks Profit and Loss Dashboard helps identify which cost categories may be affecting profitability as revenue grows, so leaders can fix profitability instead of just celebrating top-line growth.
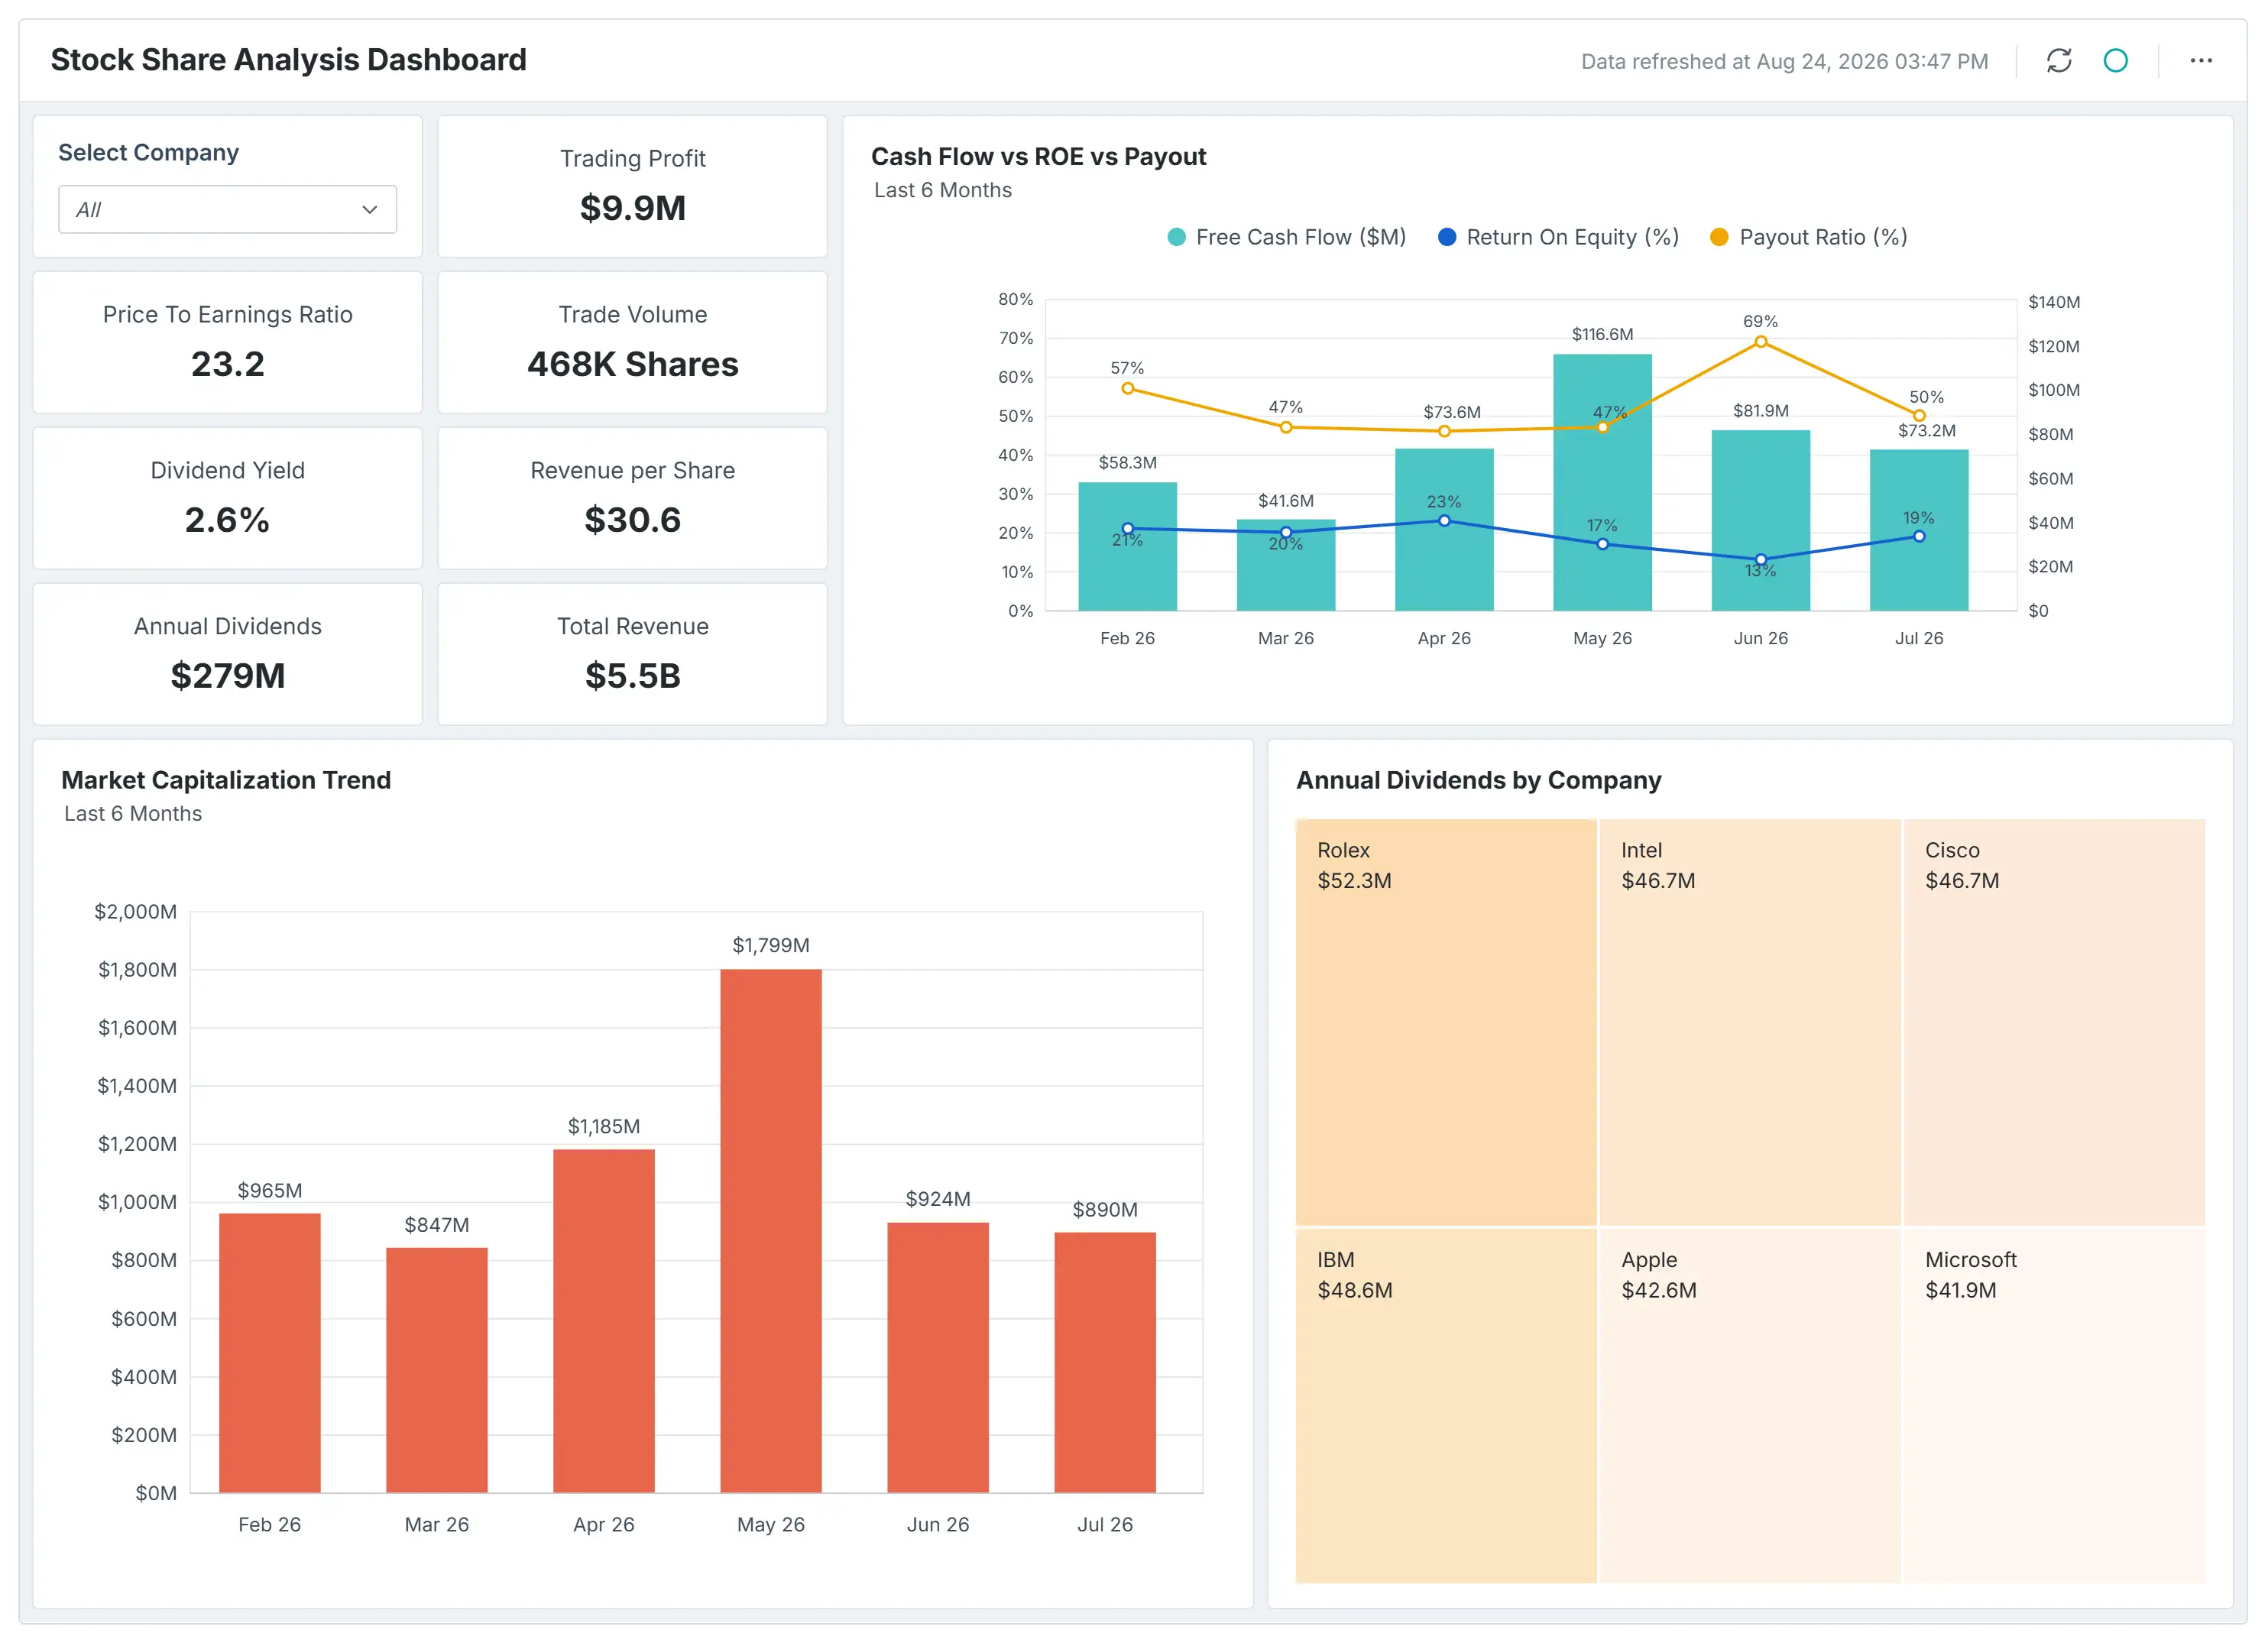
- Stock Share Analysis Dashboard connects trade volume and dividend yield in one view, so investors can compare opportunities on risk-adjusted return instead of price movement alone.
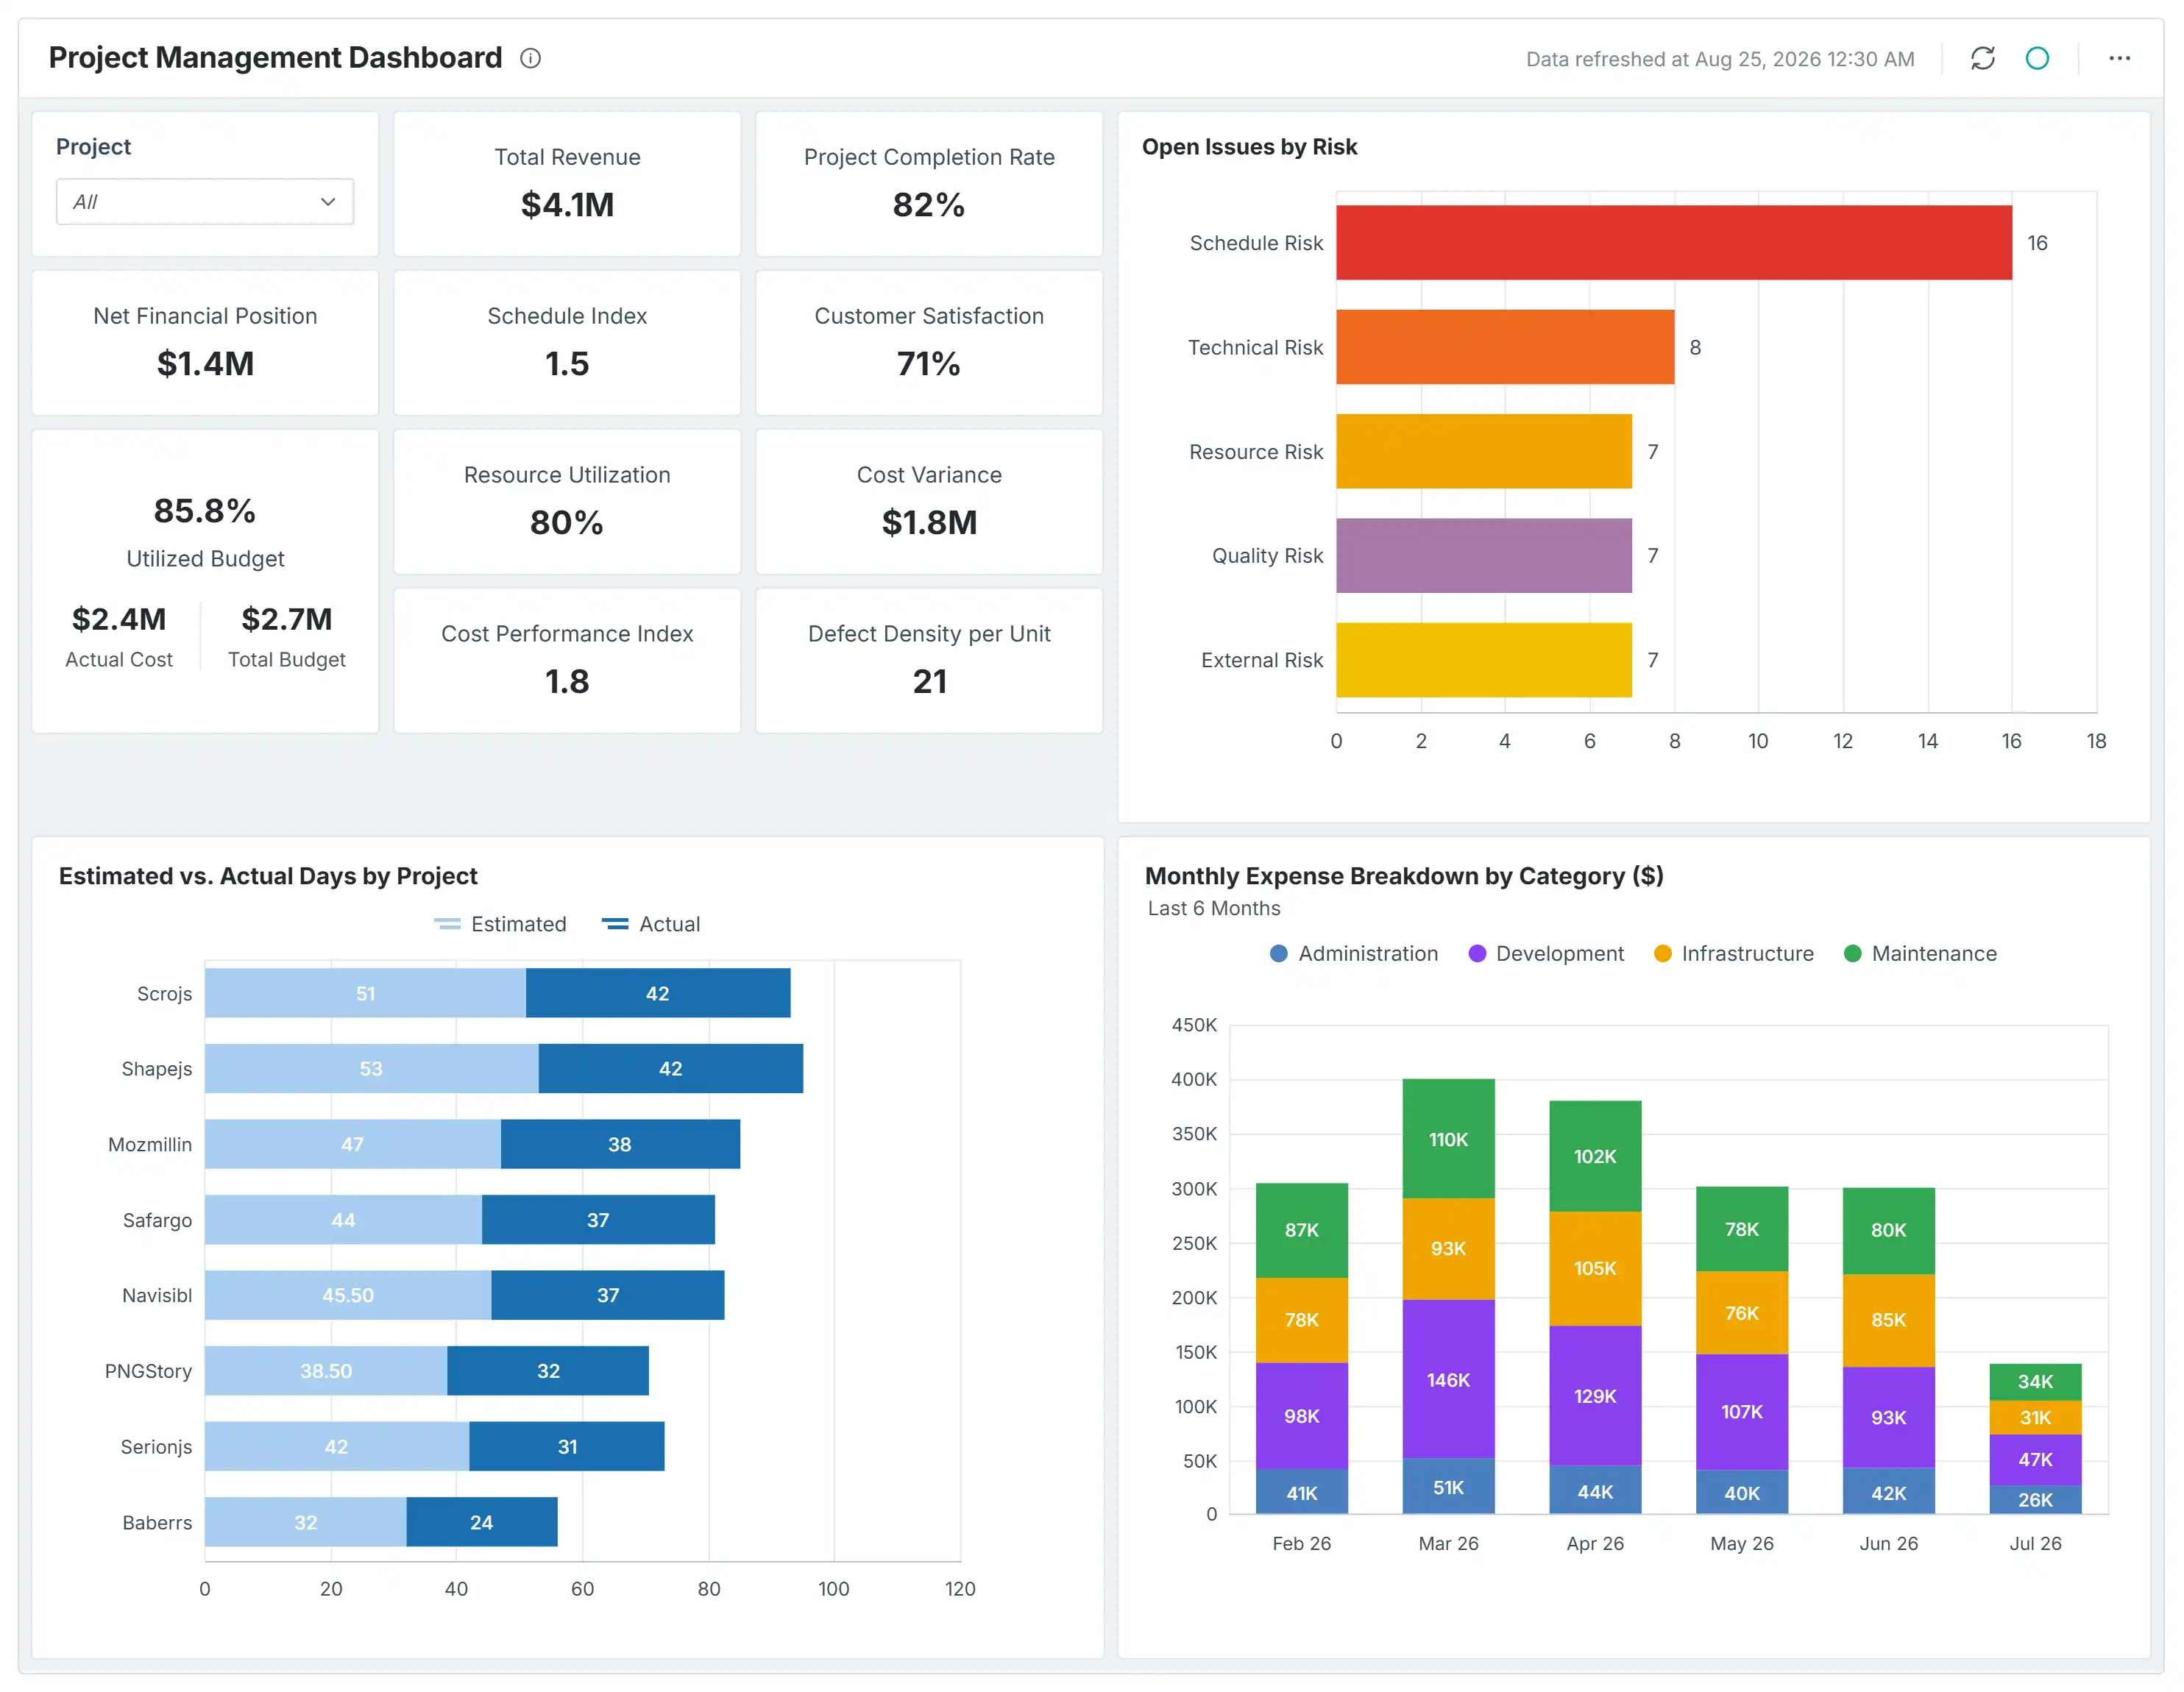
- Project Management Dashboard flags a project burning budget faster than it’s delivering revenue, so PMs can course-correct mid-project rather than explaining an overrun at closeout.
Operational Revenue Dashboards
Operational revenue dashboards help organizations understand how day-to-day business activities influence revenue outcomes. These dashboards provide visibility into process efficiency, operational performance, and revenue-related business trends across industries.
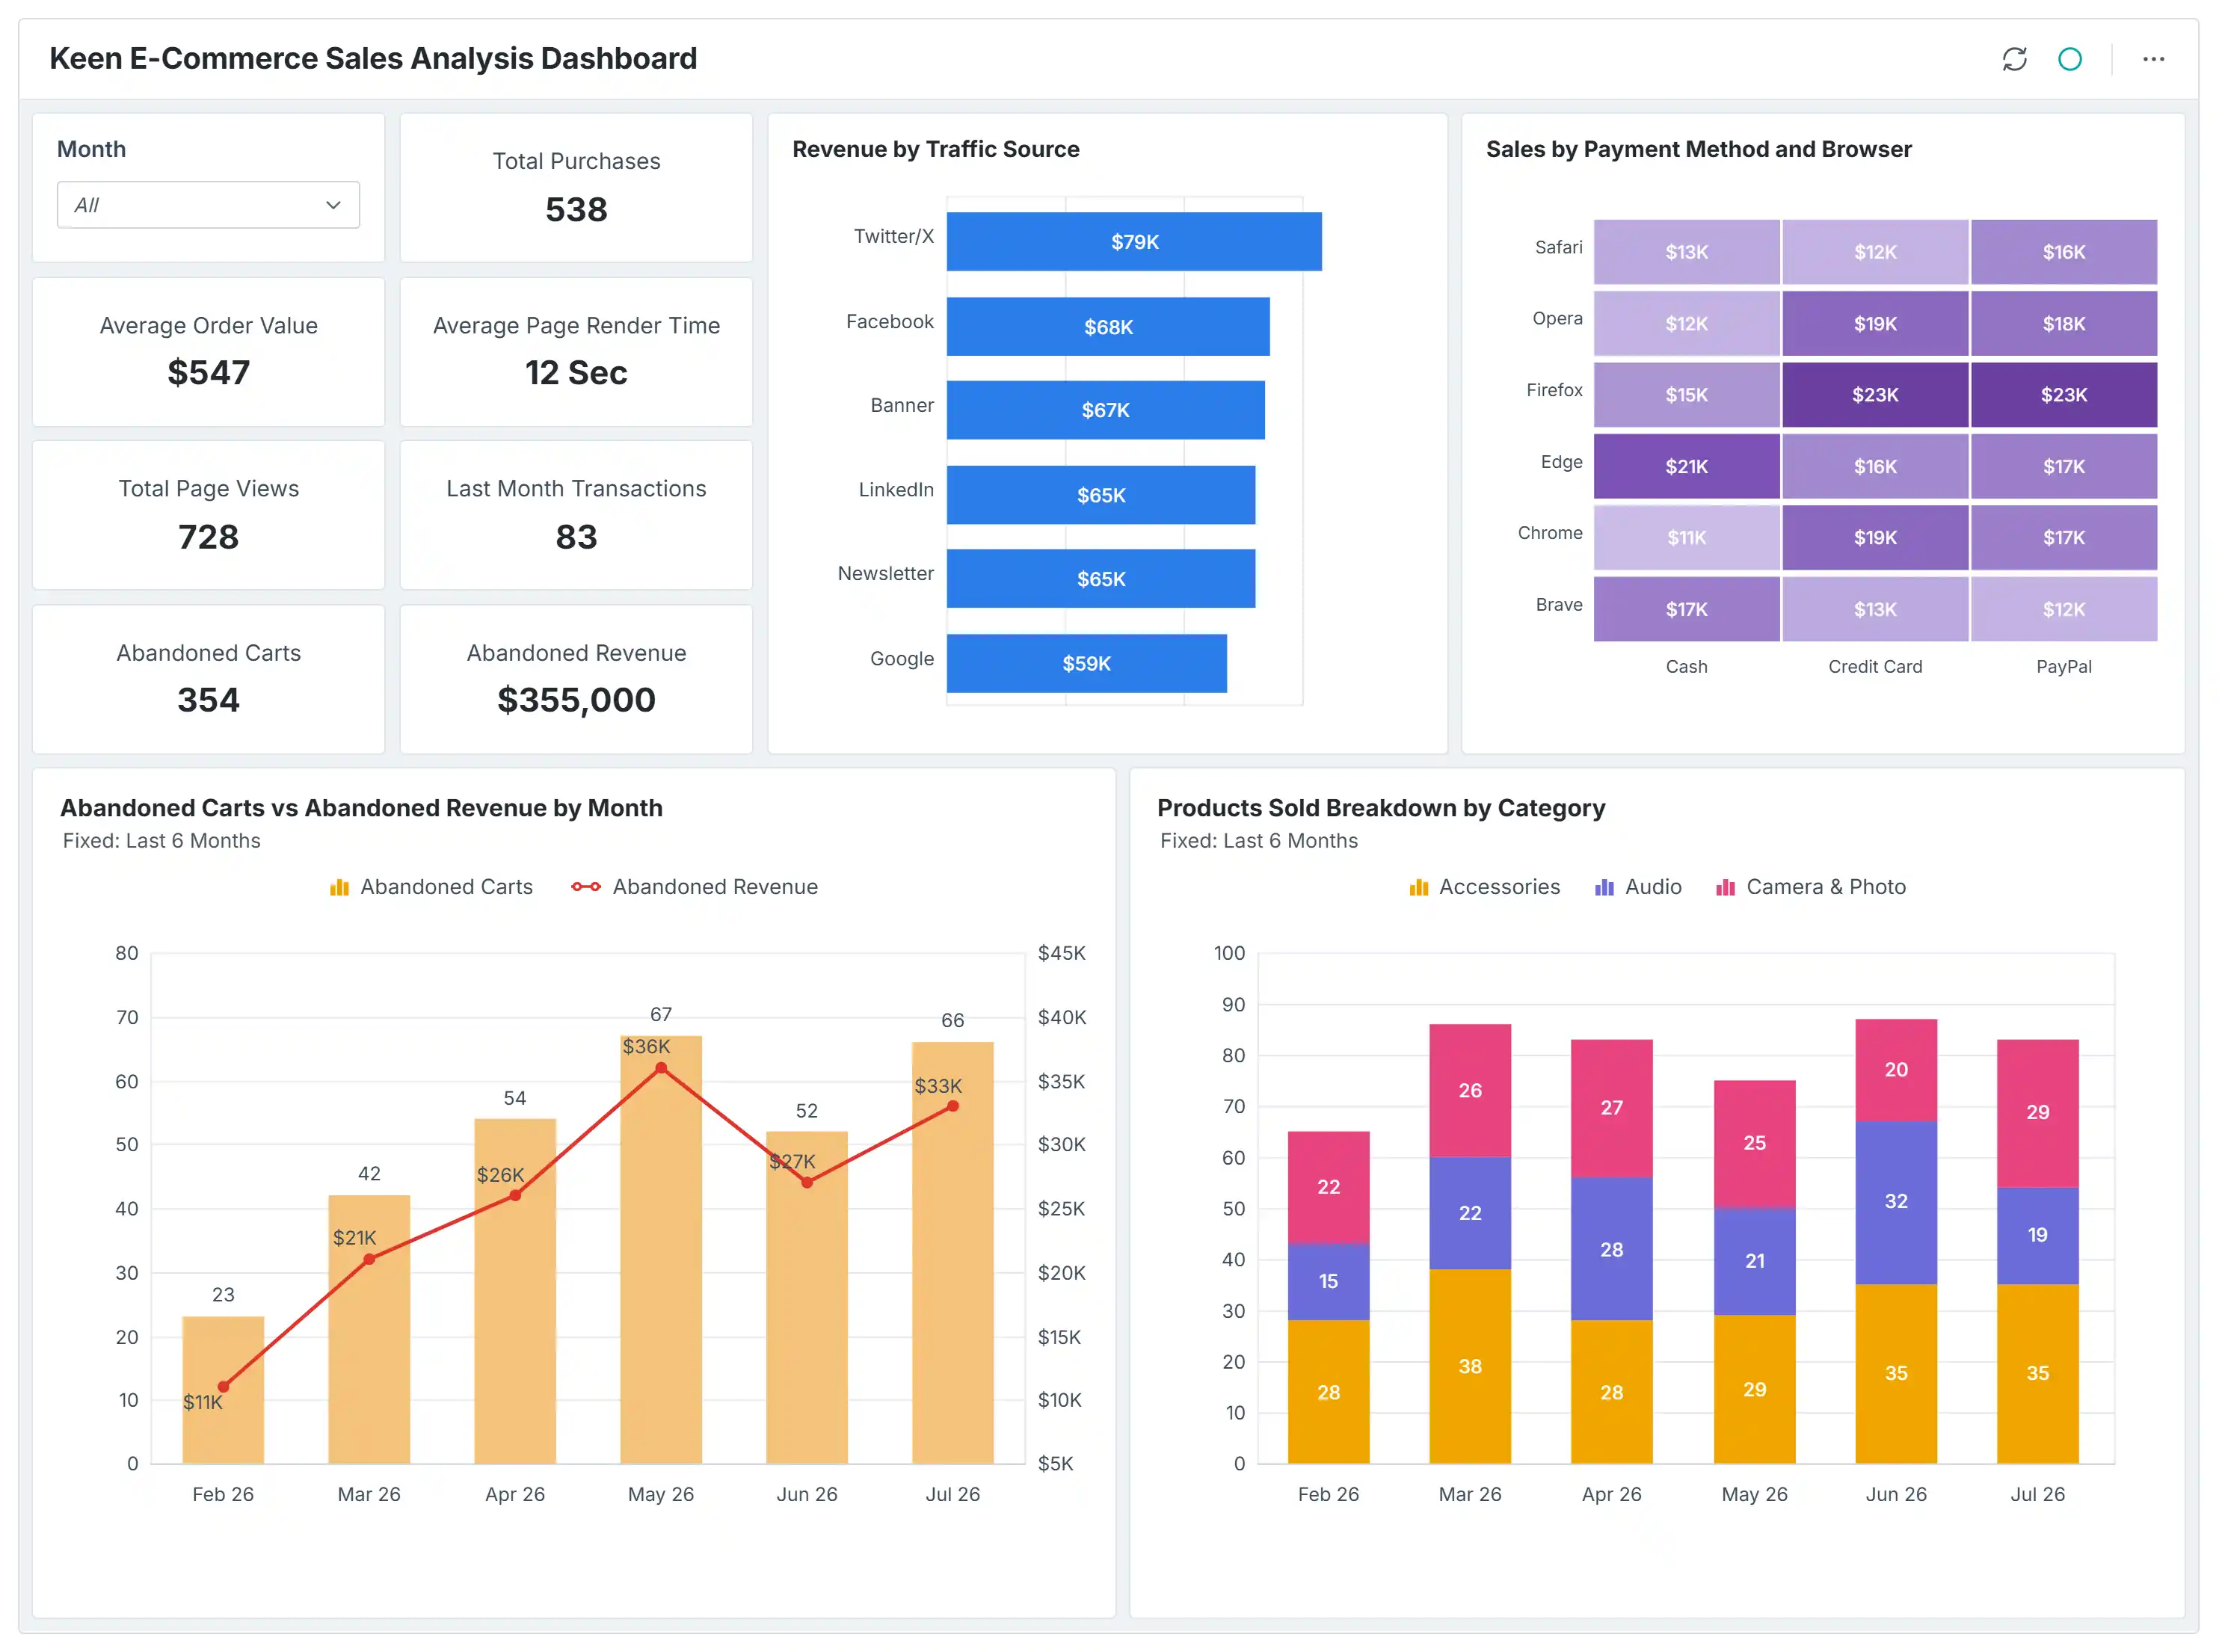
- Keen E-Commerce Sales Dashboard helps identify where shoppers are abandoning carts, so teams can fix the highest-drop-off step instead of guessing why conversion is flat.
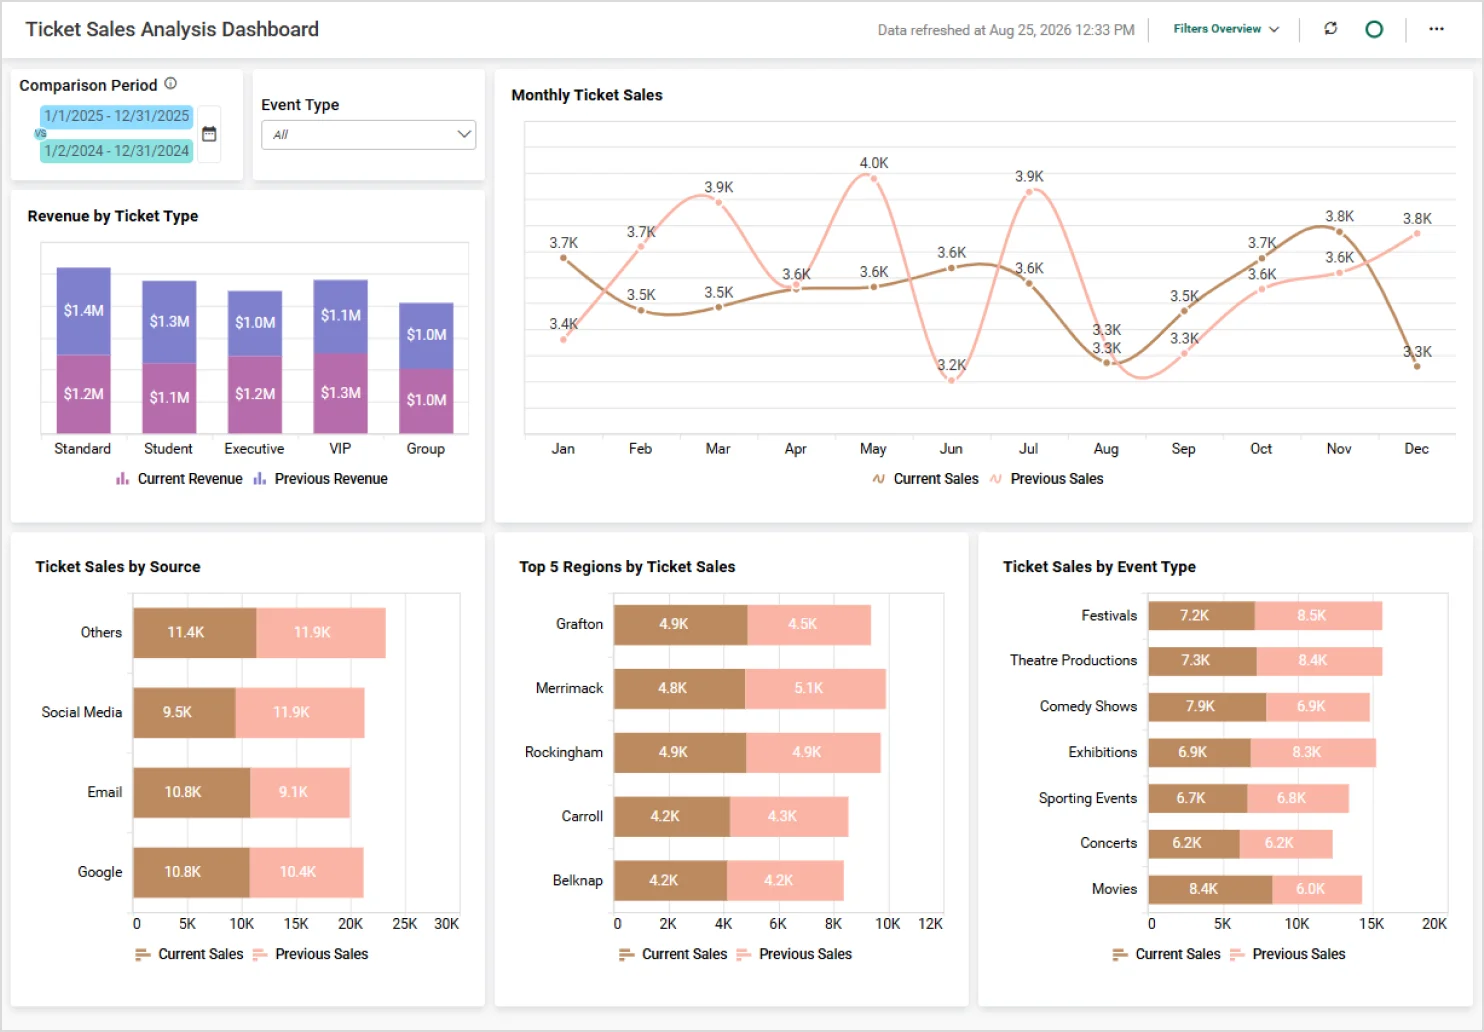
- Ticket Sales Analysis Dashboard helps identify regions or channels that may be underperforming for an event well before it happens, so organizers can shift promotion while there’s still time to fill seats.
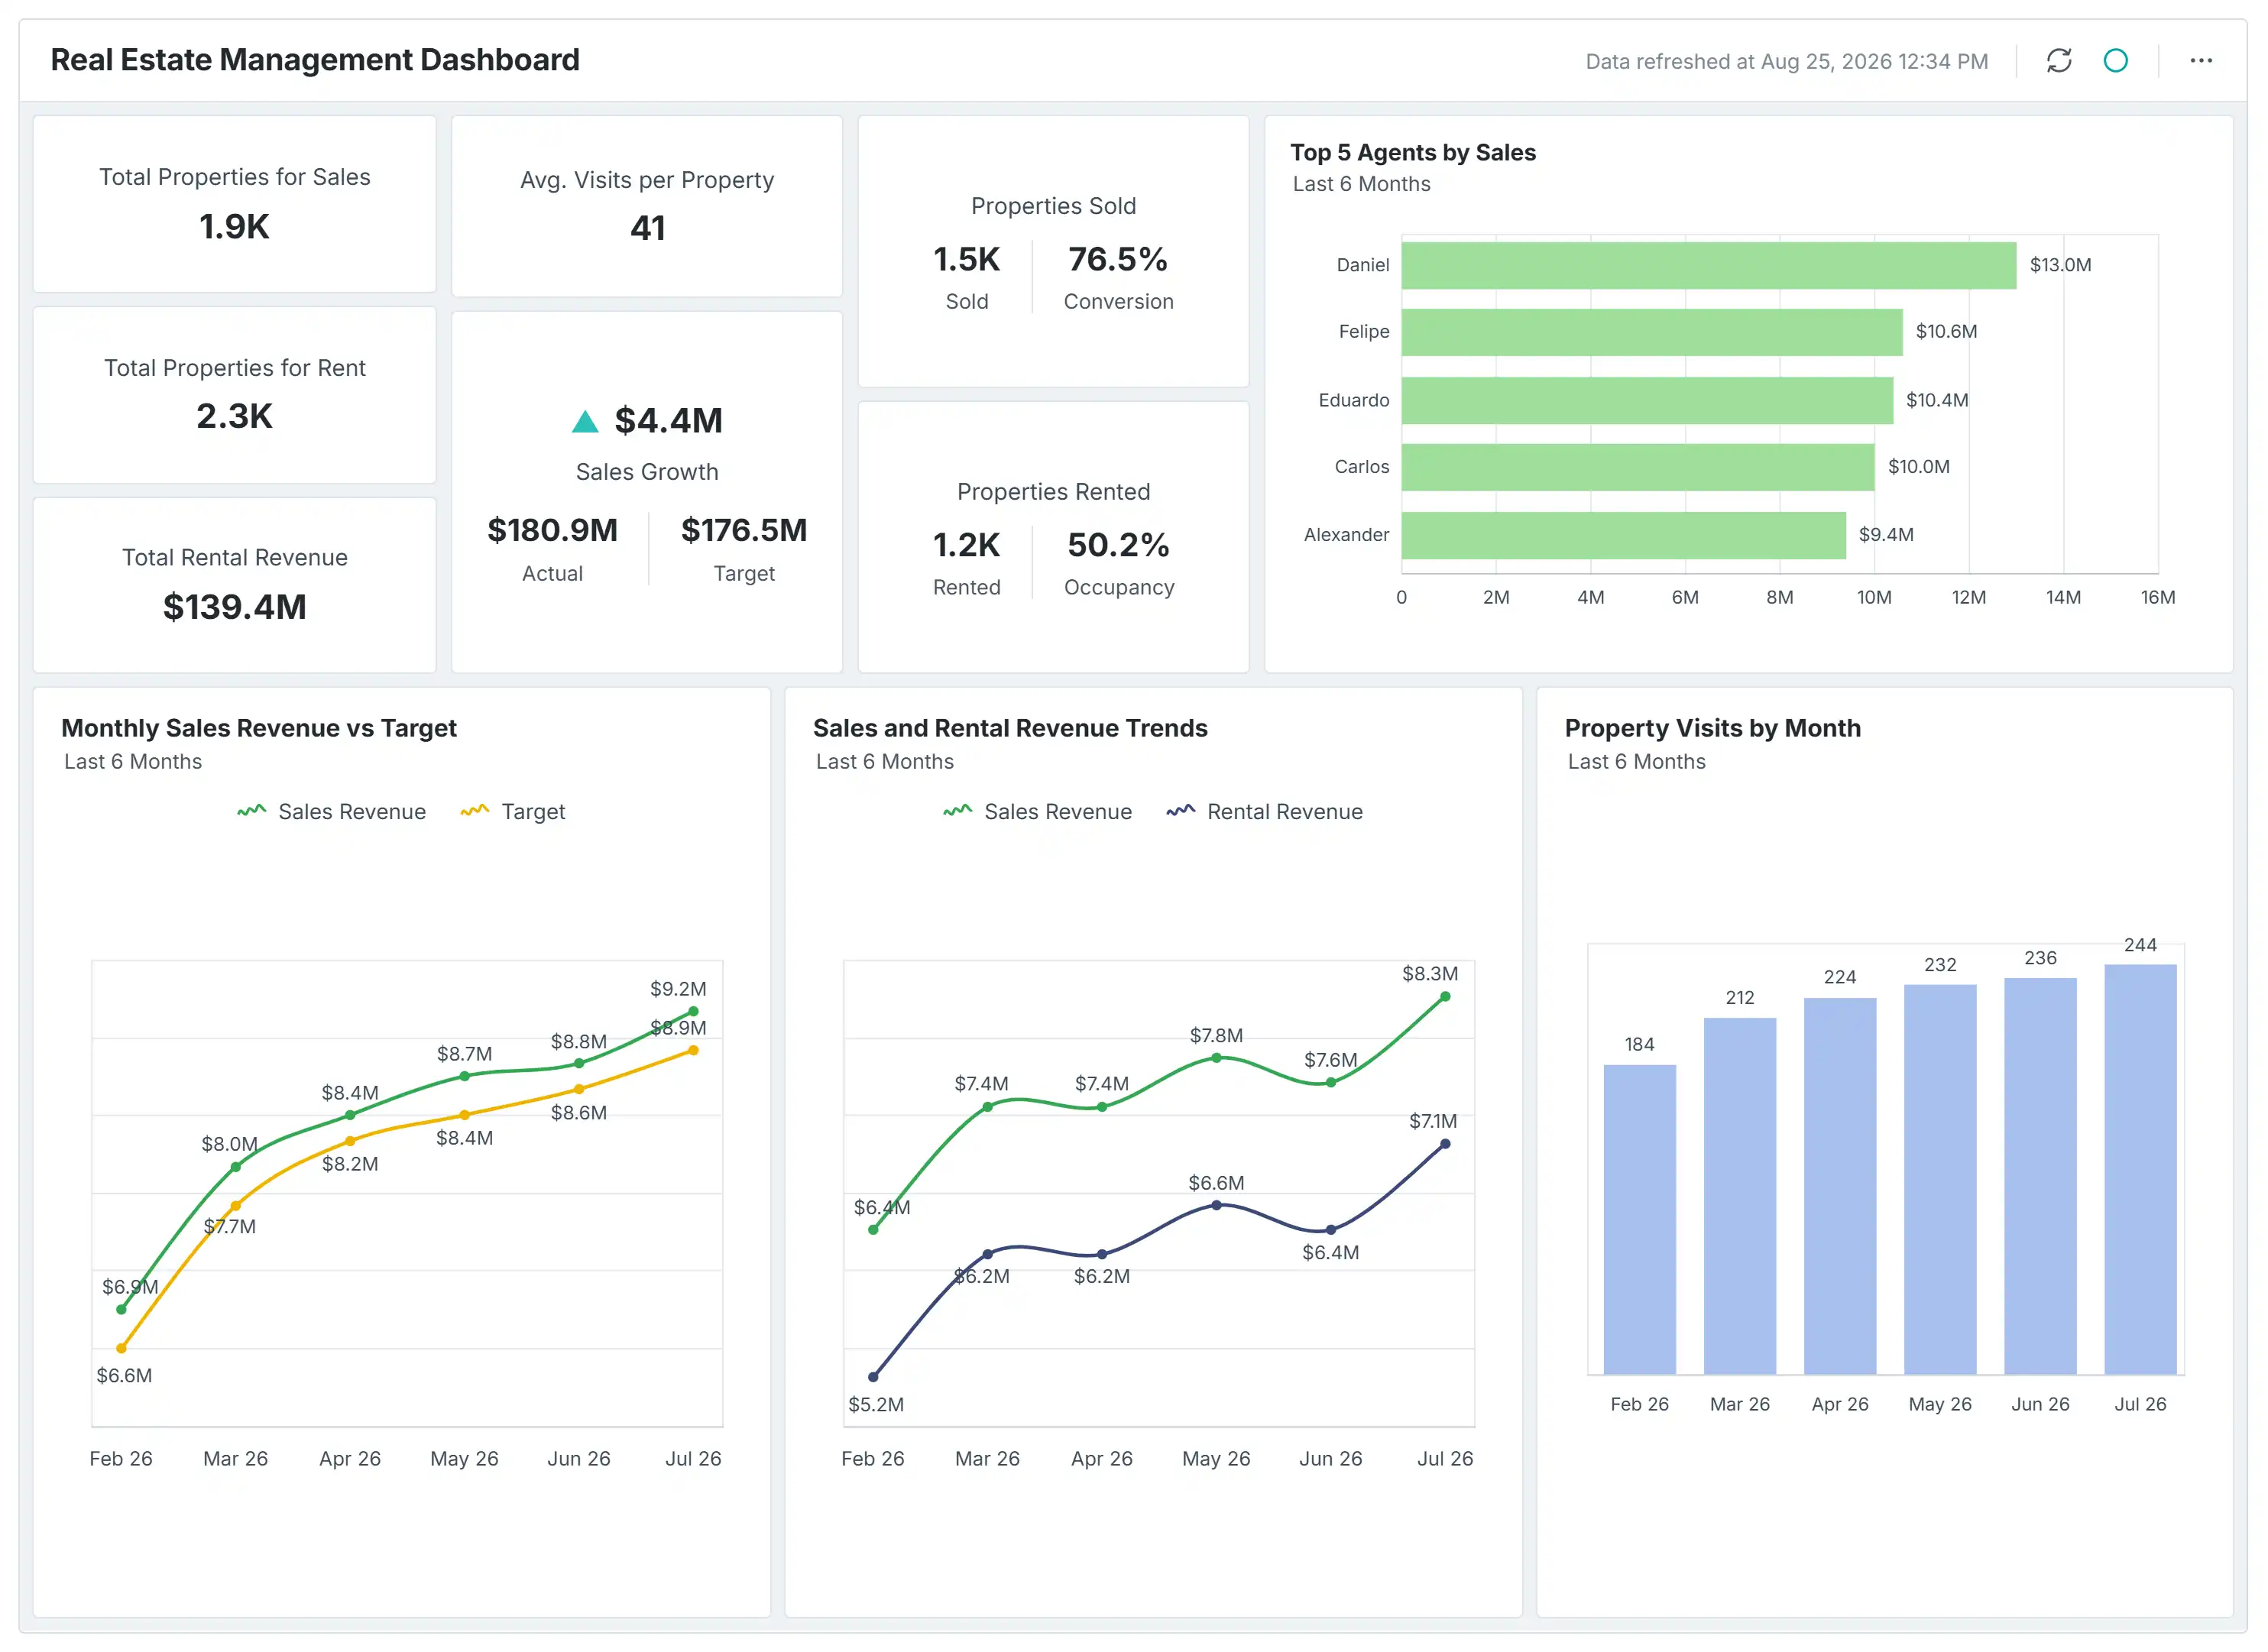
- Real Estate Management Dashboard connects occupancy rate to rental yield property-by-property, so investors can spot an underperforming asset before it drags down portfolio ROI.
Looking for more dashboard ideas? Explore Bold BI’s dashboard examples to see how organizations monitor revenue, profitability, recurring revenue, and growth metrics.
Next, let’s explore the key revenue KPIs that help organizations measure performance, monitor growth, and make informed business decisions.
Key Revenue KPIs to Track Business Growth
Revenue dashboards and KPIs help organizations move beyond revenue totals and understand the factors driving sustainable growth. The following KPIs provide insights into revenue generation, customer value, retention, profitability, and future growth potential.
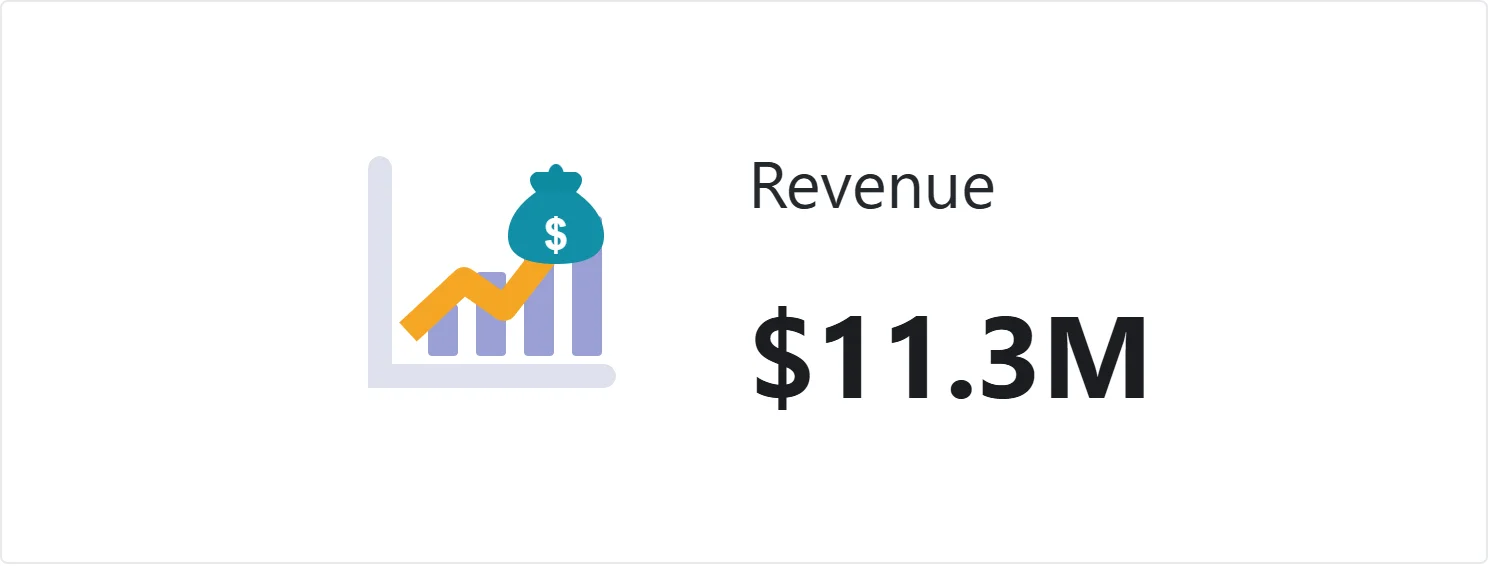
Revenue
Measures the total income generated from products or services during a specific period. Tracking revenue helps organizations evaluate overall business performance and growth.
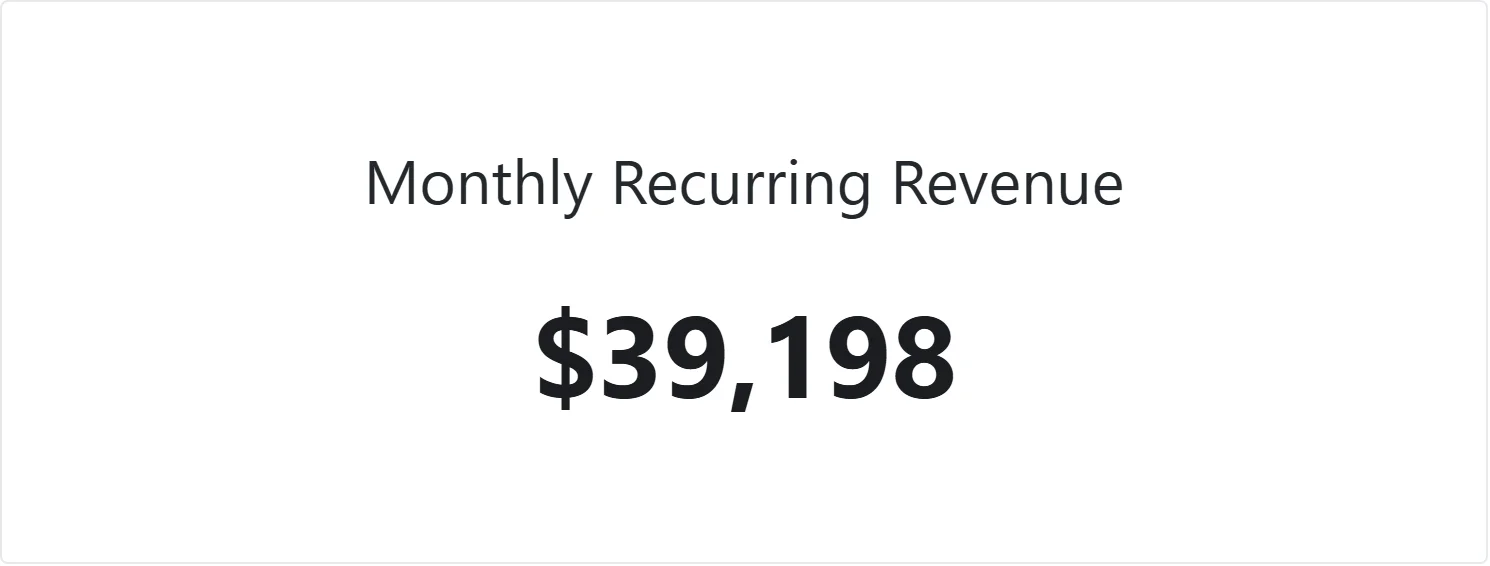
Monthly Recurring Revenue
Tracks the predictable recurring revenue generated each month from subscriptions. It is a key indicator of growth and revenue stability for subscription businesses. Consider the following MRR formula and example:
- Formula: MRR = Number of Customers × Average Monthly Subscription Fee
- Example: A CRM software provider has 500 active customers, each paying $50 per month. What is the company’s Monthly Recurring Revenue (MRR)?
- MRR = 500 × $50
- MRR = $25,000
- Result: The company generates $25,000 in MRR, making it easier to track subscription performance month over month.
Annual Recurring Revenue
Measures the annualized value of recurring subscription revenue. Organizations use ARR to evaluate long-term growth and forecast future performance. Consider the following ARR formula and example:
- Formula: ARR = MRR × 12
- Example: A project management software company generates $25,000 in Monthly Recurring Revenue (MRR) from active subscriptions. What is the company’s Annual Recurring Revenue (ARR)?
- ARR = $25,000 × 12
- ARR = $300,000
- Result: The company’s ARR is $300,000, giving leadership a clearer view of long-term subscription revenue and business growth.

Customer Lifetime Value
Estimates the total revenue a customer generates throughout their relationship with a business. A higher CLV often indicates stronger customer retention and profitability. Consider the following CLV formula and example:
- Formula: CLV = Average Revenue Per Customer × Customer Lifetime
- Example: An online fashion retailer earns an average of $150 per customer annually, and most customers continue purchasing for 4 years. What is the Customer Lifetime Value (CLV)?
- CLV = $150 × 4
- CLV = $600
- Result: The estimated CLV is $600, helping marketing teams understand how much they can spend on customer acquisition while remaining profitable.

Customer Churn Rate
Measures the percentage of customers lost during a specific period. Monitoring churn helps organizations identify retention challenges and reduce revenue loss. Consider the following churn rate formula and example:
- Formula: Churn Rate (%) = (Customers Lost During Period ÷ Customers at Start of Period) × 100
- Example: A video streaming platform starts the month with 10,000 subscribers and loses 400 subscribers by the end of the month. What is the company’s churn rate?
- Churn Rate = (400 ÷ 10,000) × 100
- Churn Rate = 4%
- Result: The company has a 4% churn rate, indicating potential opportunities to improve customer retention.

Average Revenue Per Customer
Measures the average recurring revenue generated by each customer. This KPI helps organizations understand customer value, pricing effectiveness, and revenue expansion opportunities.

Total Pipeline Value
Estimates potential future revenue from active sales opportunities. Tracking pipeline value helps improve forecasting accuracy and growth planning.

Win Rate
Measures the percentage of opportunities that convert into customers. It helps sales teams evaluate sales effectiveness and improve revenue generation.

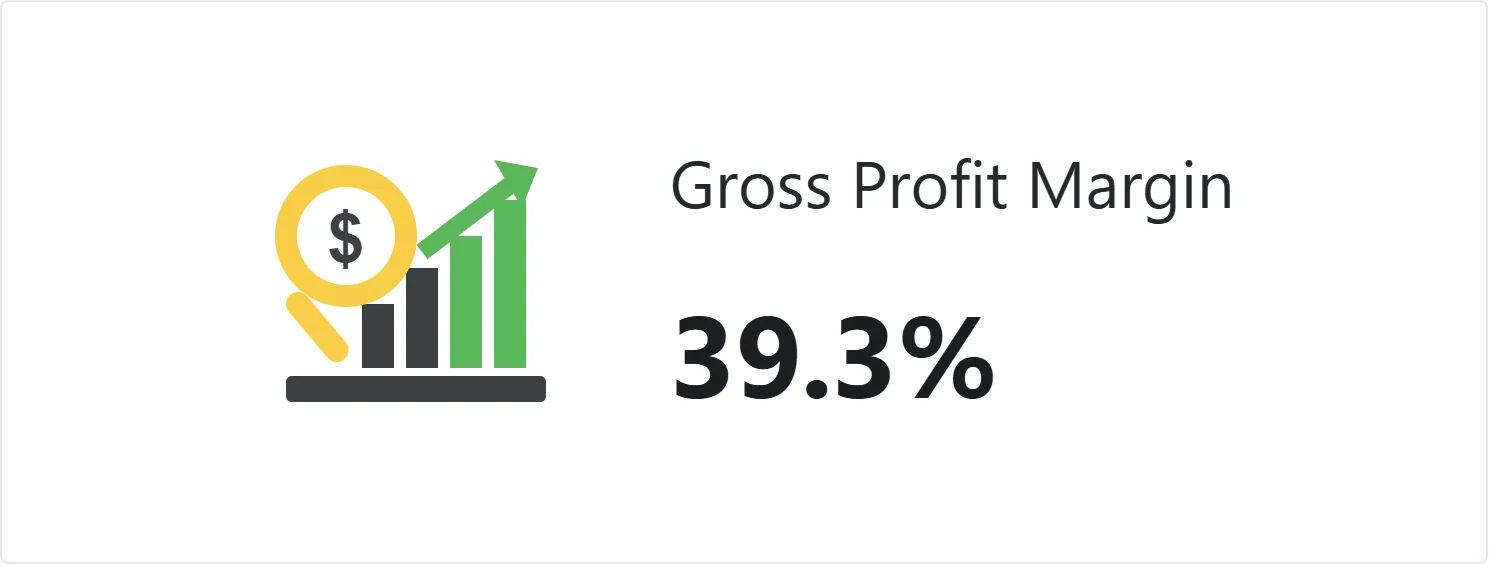
Gross Profit Margin
Measures the percentage of revenue remaining after direct costs are deducted. Monitoring this KPI helps organizations evaluate profitability and the sustainability of growth. Consider the following gross profit margin formula and example:
- Formula: Gross Profit Margin (%) = ((Revenue − Cost of Goods Sold) ÷ Revenue) × 100
- Example: A furniture manufacturer generates $200,000 in revenue and incurs $80,000 in production costs. What is the company’s Gross Profit Margin?
- Gross Profit Margin = (($200,000 − $80,000) ÷ $200,000) × 100
- Gross Profit Margin = 60%
- Result: The business maintains a 60% gross profit margin, helping finance teams evaluate profitability and cost efficiency.
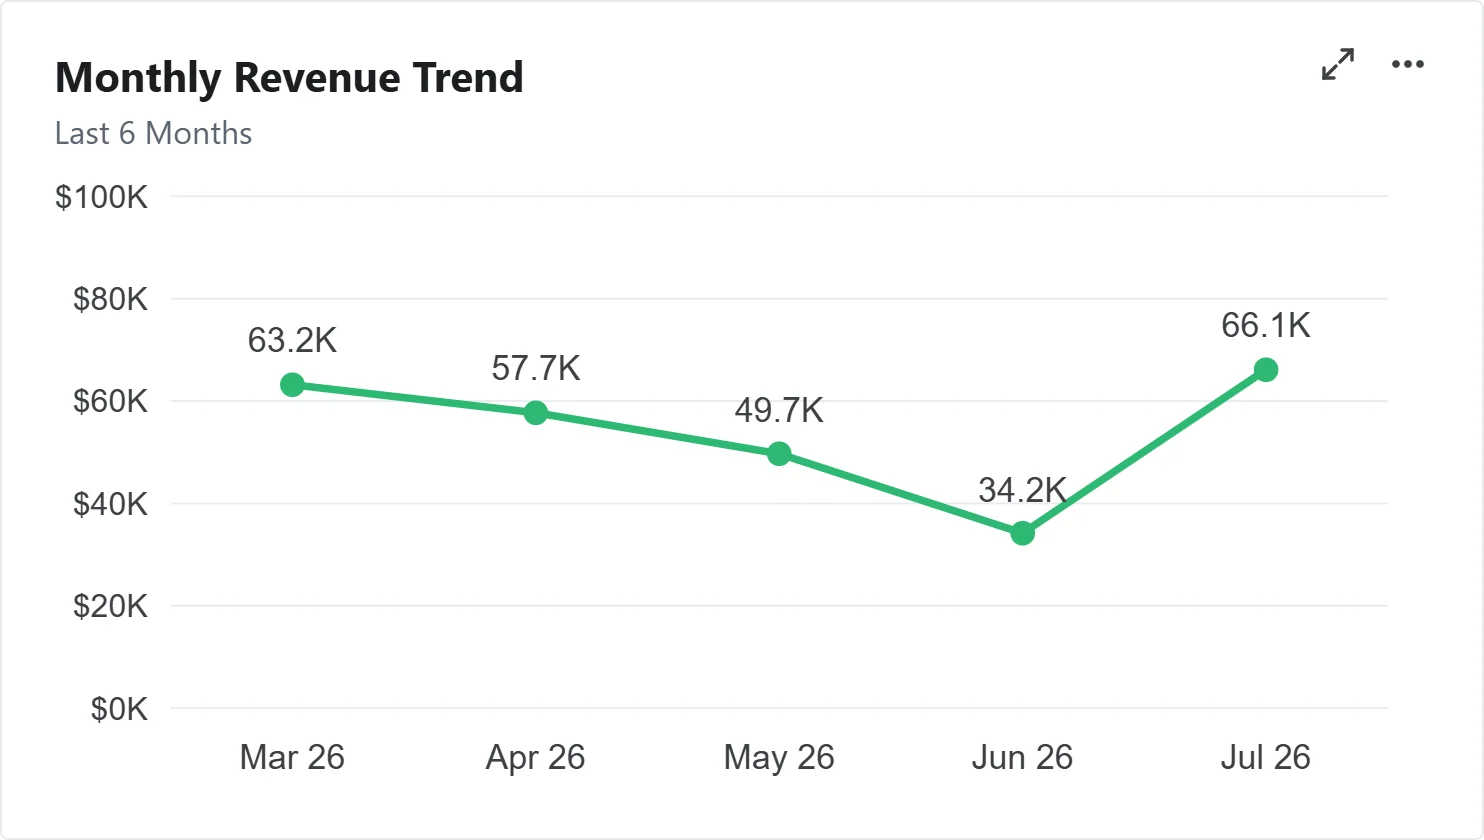
Monthly Revenue Trend
Tracks changes in revenue over time, helping organizations identify growth patterns, seasonal fluctuations, and emerging business opportunities or risks.
Outstanding Revenue
Represents revenue that has been invoiced but not yet collected. Monitoring this KPI helps finance teams improve cash flow management, reduce collection delays, and identify potential payment issues.

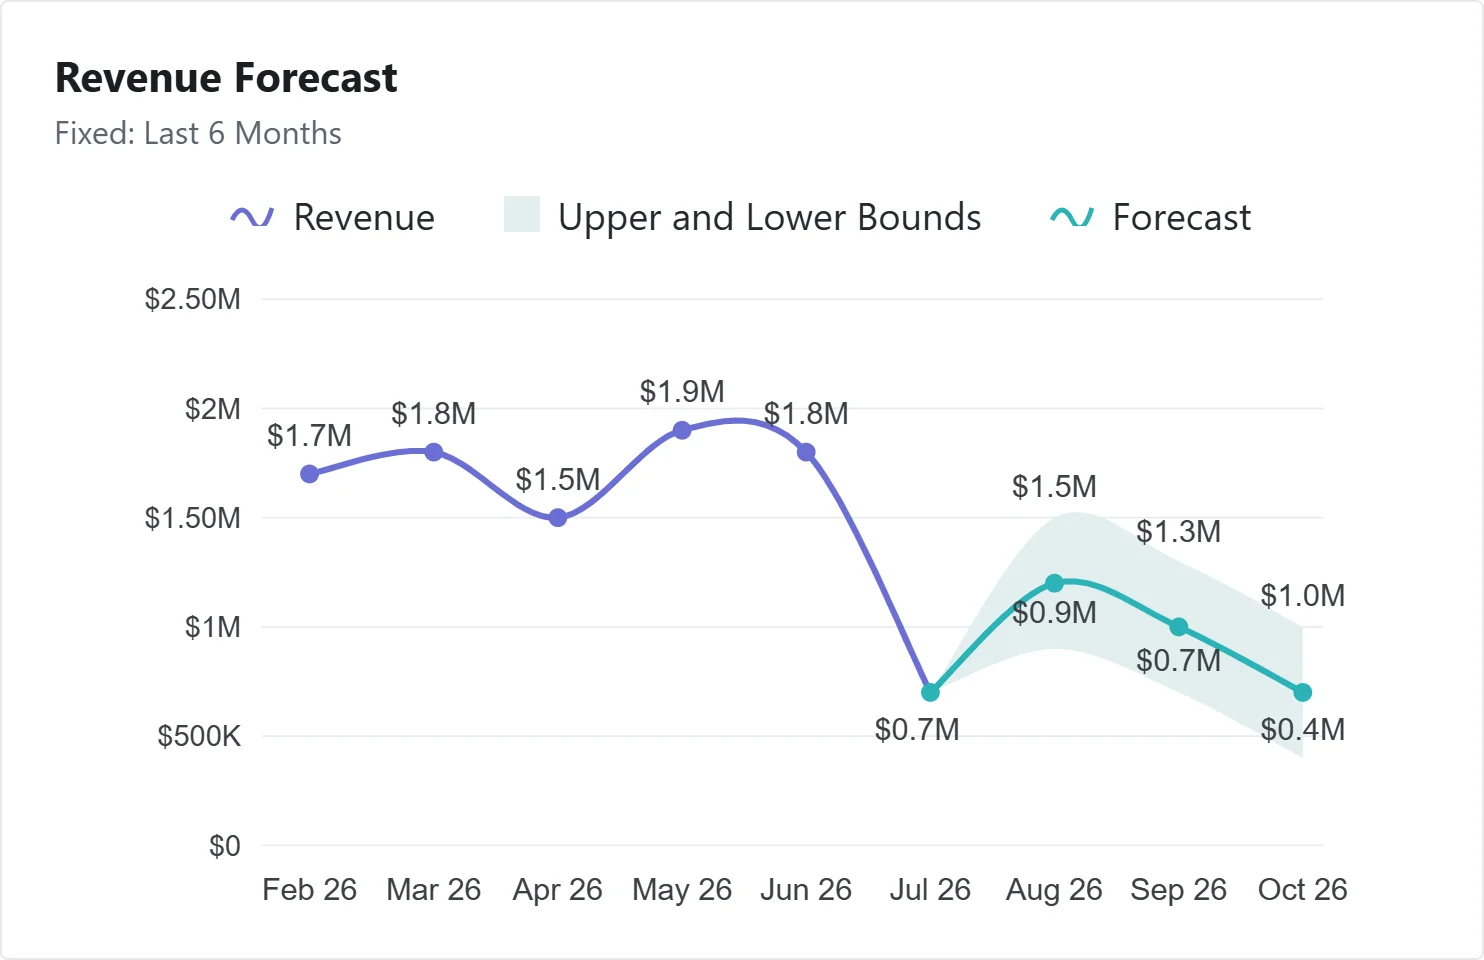
Revenue Forecast
Estimates future revenue based on historical performance, pipeline data, market conditions, and business trends. This KPI helps organizations plan budgets, allocate resources, and make informed strategic decisions.
Earned Revenue
Represents revenue that has been recognized after goods or services have been delivered. Tracking earned revenue helps organizations maintain accurate financial analytics and understand actual business performance.
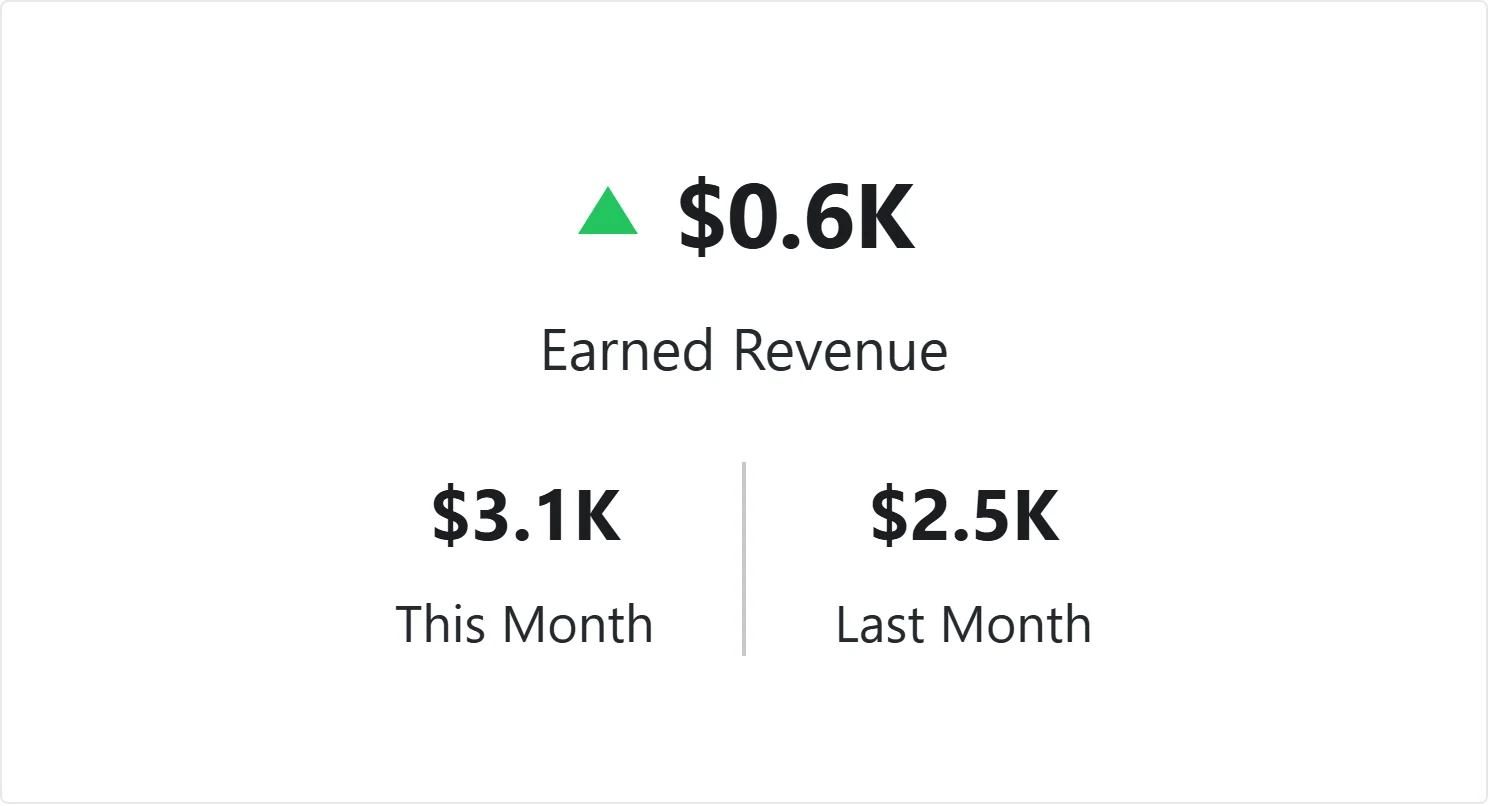
Together, these KPIs provide a balanced view of business growth by measuring revenue generation, customer acquisition, retention, profitability, cash flow, and future revenue potential. When monitored through revenue dashboards, they help organizations identify opportunities, mitigate risks, and make more informed growth decisions.
How to Build a Revenue Dashboard
Before choosing a dashboard platform, it’s important to understand the steps involved in creating an effective revenue dashboard.
- Define your audience: Identify who will use the dashboard and the decisions it should support.
- Select the right metrics: Choose KPIs aligned with business objectives, such as Revenue, MRR, ARR, churn, pipeline value, and customer retention.
- Apply the 30-second rule: Users should understand overall performance within a few seconds of opening the dashboard.
- Design a logical layout: Place high-level KPIs at the top and support charts below.
- Choose the right analytics tool: Select a solution capable of connecting CRM systems, subscription platforms, marketing applications, and finance tools.
To learn how to design dashboards that are clear, actionable, and user-friendly, explore our 10 Dashboard Design Best Practices for Insights blog.
Why Choose Bold BI for Revenue Dashboards?
Revenue data is often distributed across multiple systems, making it difficult to maintain a complete view of business performance. Bold BI® helps teams build revenue dashboards and KPIs that provide a consistent view of business performance across sales, finance, marketing, and subscription systems. With Bold BI, teams can:
- Connect revenue data across systems: Combine data from CRM platforms, subscription management tools, payment gateways, financial applications, databases, and cloud services into a unified analytics environment.
- Monitor revenue performance in real time: Track revenue trends, subscription activity, refunds, orders, and payment status using up-to-date information.
- Analyze revenue from multiple perspectives: Explore revenue alongside supporting metrics to better understand the factors influencing business performance.
- Enable interactive analysis: Drill into revenue metrics, apply filters, compare performance across segments, and explore the drivers behind revenue growth through interactive dashboards.
- Enable self-service analytics: Allow business users across departments to explore data, create dashboards, and access insights without requiring extensive technical support or IT involvement.
- Share insights across teams: Provide finance, sales, operations, and leadership teams with access to consistent revenue metrics and dashboards.
- Embed revenue dashboards anywhere: Deploy dashboards within internal portals, customer-facing applications, intranets, and SaaS products using embedded analytics and white-label capabilities that allow organizations to customize branding and user experience.
- Build dashboards for different business needs: Create dashboards tailored to revenue analysis, subscription management, sales performance, financial analytics, and other business functions.
- Get answers, not just charts: Ask Bold BI’s AI Assistant natural-language questions about your dashboard data and receive AI-generated insights. Instead of simply noticing that MRR dropped this month, you can explore whether the change is related to customer segments, pricing changes, or renewal trends. The AI Assistant surfaces patterns and insights, while your team remains in control of decisions.
Whether you’re monitoring recurring revenue, evaluating revenue quality, or analyzing growth trends, Bold BI provides the flexibility to turn revenue data into actionable business insights.
Conclusion
Revenue performance is shaped by more than a single metric. Revenue dashboards and KPIs help organizations understand the factors influencing growth, profitability, customer retention, and recurring revenue performance. By monitoring revenue, subscriptions, refunds, orders, and payment activity together, organizations can gain a clearer understanding of business performance and growth trends.
Revenue dashboards and KPIs bring these insights together, making it easier to track performance, identify opportunities, and support data-driven decisions.
Ready to turn your revenue data into actionable insights? Explore Bold BI®’s Revenue Analysis Dashboard solution and discover how interactive analytics can help your team monitor performance, uncover growth opportunities, and make more informed business decisions. Start your free trial or schedule a personalized demo today.
Frequently Asked Questions
- 1.
What is a revenue dashboard?
A revenue dashboard provides a centralized view of revenue performance, helping organizations track revenue, subscriptions, refunds, and other key metrics in one place.
- 2.
What are revenue dashboards and KPIs?
Revenue dashboards visualize business performance, while revenue KPIs measure the metrics that drive growth, profitability, and customer retention.
- 3.
What KPIs should a revenue dashboard include?
Common revenue KPIs include revenue, MRR, ARR, customer lifetime value (CLV), churn rate, average revenue per customer, pipeline value, win rate, gross profit margin, monthly revenue trend, outstanding revenue, revenue forecast, and earned revenue.
- 4.
Who uses revenue dashboards?
Revenue operations teams, finance leaders, sales managers, executives, and business analysts use revenue dashboards to monitor performance and support decision-making.
- 5.
How is a revenue dashboard different from a sales dashboard?
A sales dashboard focuses on pipeline and sales activities, while a revenue dashboard provides a broader view of revenue, retention, profitability, and financial performance.
- 6.
Can revenue dashboards combine data from multiple systems?
Yes. Revenue dashboards can consolidate data from CRM, finance, subscription, payment, marketing, and other business systems into a single view.
- 7.
How can I create a revenue dashboard with Bold BI?
Bold BI enables organizations to create revenue dashboards by connecting multiple data sources and visualizing key revenue KPIs through interactive dashboards.
- 8.
Do I need technical expertise to create a revenue dashboard?
No. Bold BI offers self-service analytics, pre-built templates, and drag-and-drop dashboard creation tools that require minimal technical expertise.
- 9.
Will my revenue dashboard stay accurate as data changes?
Yes. Bold BI automatically refreshes data from connected systems, helping ensure your revenue dashboard reflects the latest available information.
- 1.