

Stripe Subscription Performance Dashboard
Improve recurring revenue predictability, reduce churn risk, and optimize subscription growth with clear, subscription‑focused insights.
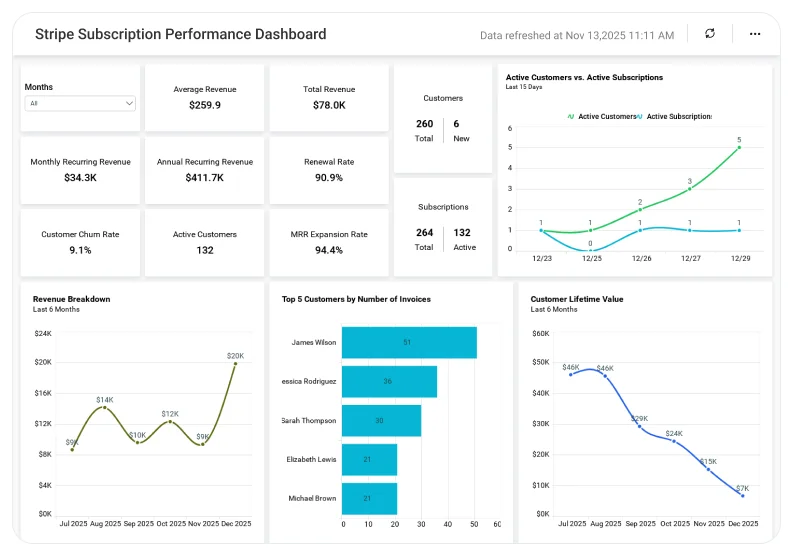
The Stripe Subscription Performance Dashboard helps revenue, finance, and sales teams understand how subscriptions perform across plans and customers, enabling them to improve retention, forecast MRR, and make better pricing decisions.
TL;DR
-
Track MRR, ARR, and active subscription trends to understand recurring revenue health.
-
Monitor new subscriptions, upgrades, downgrades, and cancellations to see how revenue evolves.
-
Analyze churn and retention patterns by plan and customer segment to reduce revenue risk.
-
Compare revenue contribution across subscription plans to optimize pricing and packaging.
-
Support accurate forecasting and growth decisions with data-driven subscription insights.
What Is a Stripe Subscription Performance Dashboard?
A Stripe Subscription Performance Dashboard turns Stripe subscription and billing data into clear insights on revenue growth, customer lifecycle, and retention.
With Bold BI, Stripe subscription data is transformed into interactive dashboards that give teams a unified view of recurring revenue health without relying on fragmented billing reports.
Why Stripe Subscription Performance Dashboard Matters
Subscription-based businesses depend on predictable revenue and long-term customer retention.
When subscription data is reviewed only through raw billing reports:
-
Churn signals appear too late.
-
Revenue forecasts lack accuracy.
-
Plan performance comparisons are unclear.
-
Growth decisions rely on assumptions.
A centralized subscription dashboard helps teams identify churn risks earlier and actively optimize subscription growth.
What You’ll Track
Using Bold BI dashboards, you will track important KPIs such as:
-
MRR & ARR trends: Recurring revenue growth over time to assess business momentum.
-
Subscription lifecycle events: New sign-ups, upgrades, downgrades, and cancellations.
-
Churn & retention rates: Customer and revenue churn patterns by plan or segment.
-
Plan-wise performance: Revenue and subscriber distribution across pricing plans.
All dashboards are fully customizable, allowing you to add KPIs or metrics as needed.
How It Works
-
Connect Stripe subscription and billing data to Bold BI.
-
Apply the Stripe Subscription Performance Dashboard sample.
-
Combine customer, plan, and revenue data into a unified model.
-
Analyze insights by plan, customer segment, or time period.
-
Share dashboards with sales, finance, and leadership teams.
Why Bold BI Is the Right Fit for Stripe Subscription Performance Analytics
-
Provides a single view of recurring revenue health: Brings subscriptions, revenue, and churn into one consistent dashboard.
-
Improves churn awareness and retention planning: Highlights cancellation and downgrade patterns early.
-
Supports accurate revenue forecasting: Uses historical MRR and lifecycle trends to strengthen forecasts.
-
Aligns sales, finance, and leadership teams: Ensures everyone works from the same subscription metrics.
-
Scales with growing subscription businesses: Designed for SaaS and recurring-revenue models with high data volumes.
Compare Options (at a glance)
| Feature | Bold BI | Stripe Dashboard | Spreadsheets |
| Subscription performance analytics | Yes | Limited | Manual |
| MRR, ARR & churn insights | Yes | Partial | Manual |
| Plan & customer drilldowns | Yes | Limited | Manual |
| Trend & lifecycle analysis | Yes | Limited | No |
| Custom KPIs & dashboards | Fully customizable | Fixed | Manual |


