Website Analytics Dashboard
Understand website performance to improve traffic quality, engagement, and conversions.
The Website Analytics Dashboard helps teams analyze visitor behavior, traffic sources, page performance, and user journeys, enabling better content decisions, improved user experience and higher conversion outcomes.
TL;DR
-
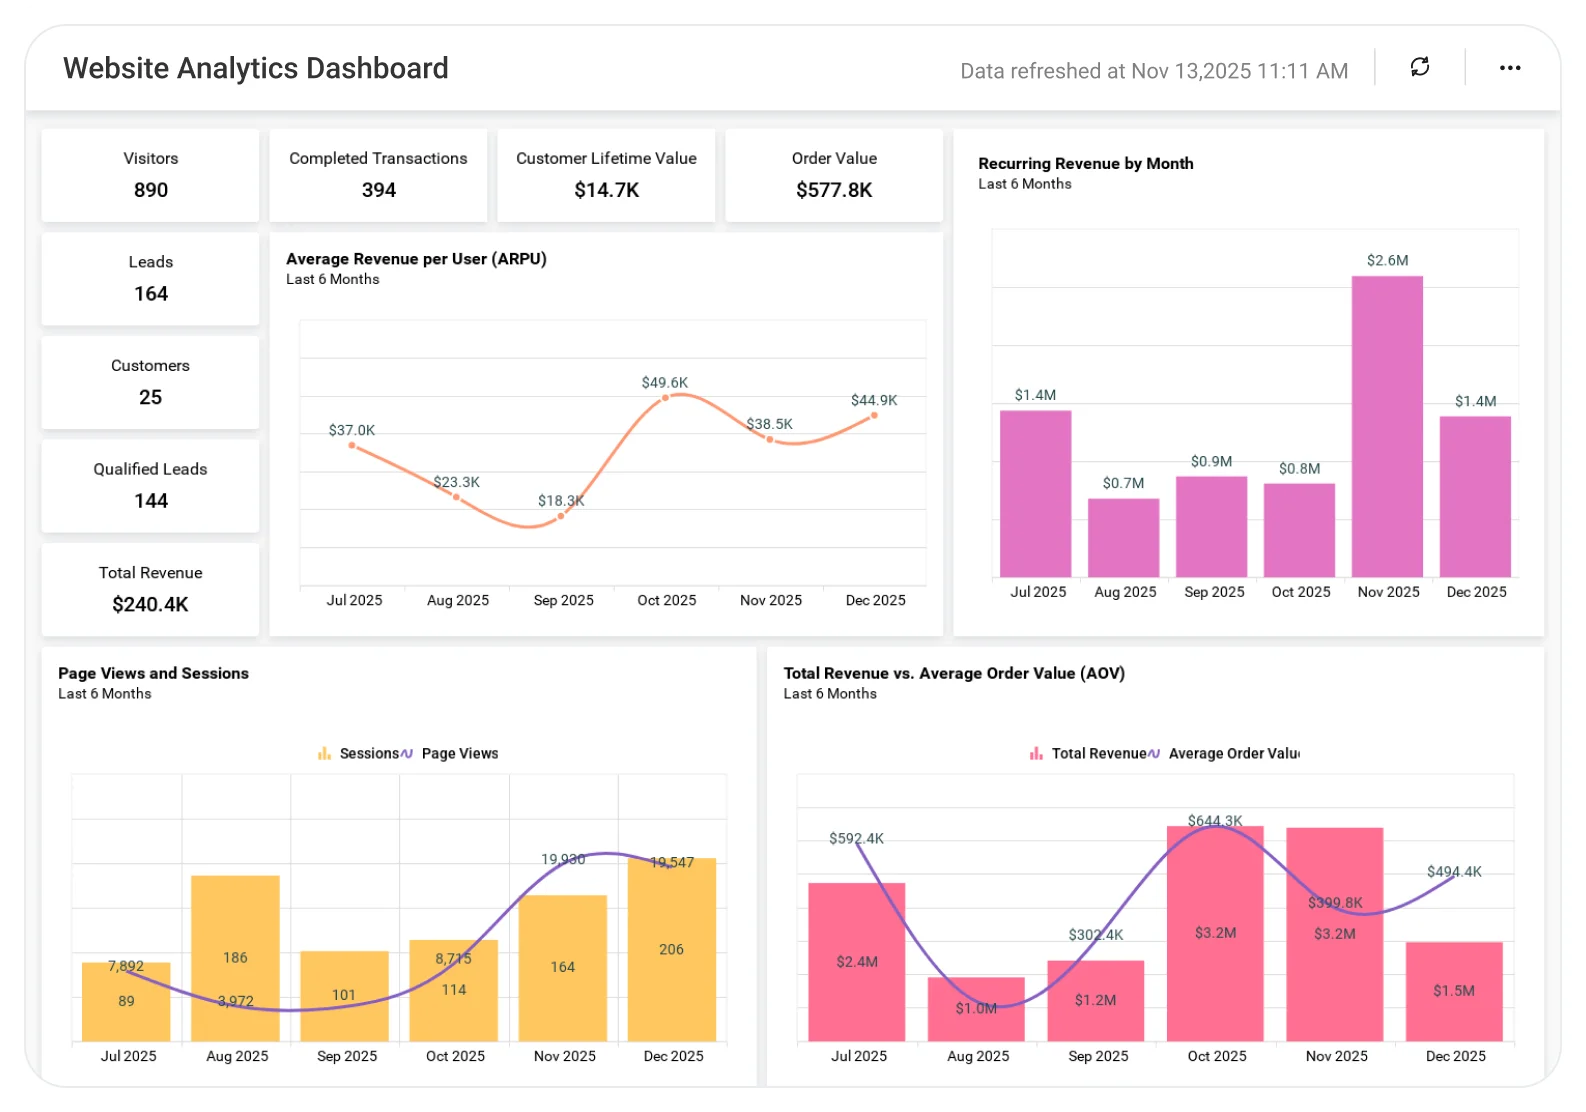
Total visitors, leads, qualified leads, and customers.
-
Bounce rate and visitor engagement indicators.
-
Revenue by marketing and sales channel.
-
Top landing pages driving sales.
-
Recurring revenue, ARPU, and customer lifetime value.
-
A unified view of website and revenue performance.
What Is a Website Analytics Dashboard?
A Website Analytics Dashboard is a visual analytics tool that connects website traffic, lead generation, and revenue metrics into a single view.
In Bold BI, it becomes an interactive, customizable dashboard that helps teams understand how website activity contributes to conversions, recurring revenue, and customer lifetime value.
Why Website Analytics Dashboard Matters
Website analytics shouldn’t stop at traffic numbers, they should clearly show how traffic turns into leads, customers, and revenue.
Without a unified dashboard, teams struggle to answer questions like:
-
How many customers are visiting our website?
-
How many leads and qualified leads are we generating?
-
Which channels actually drive sales?
-
How much recurring revenue do we have?
-
Which pages contribute the most to revenue?
Bold BI answers these questions in one place, helping marketing and growth teams align website performance with business outcomes.
What You’ll Track
-
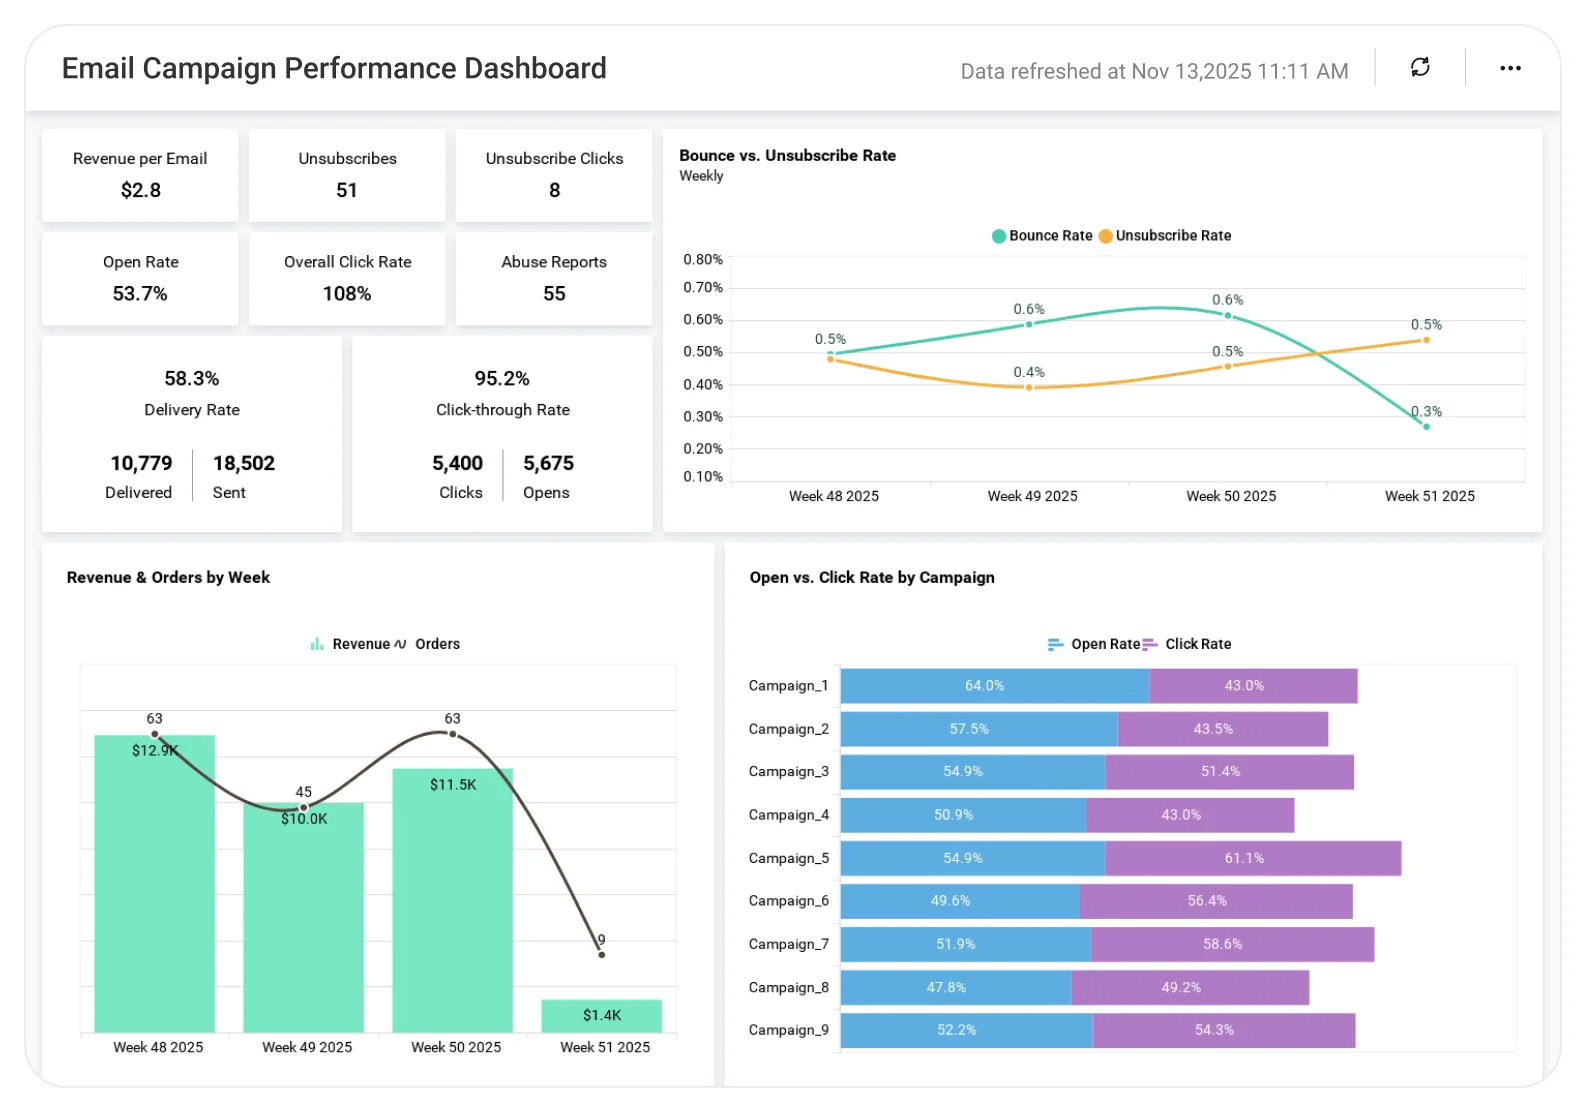
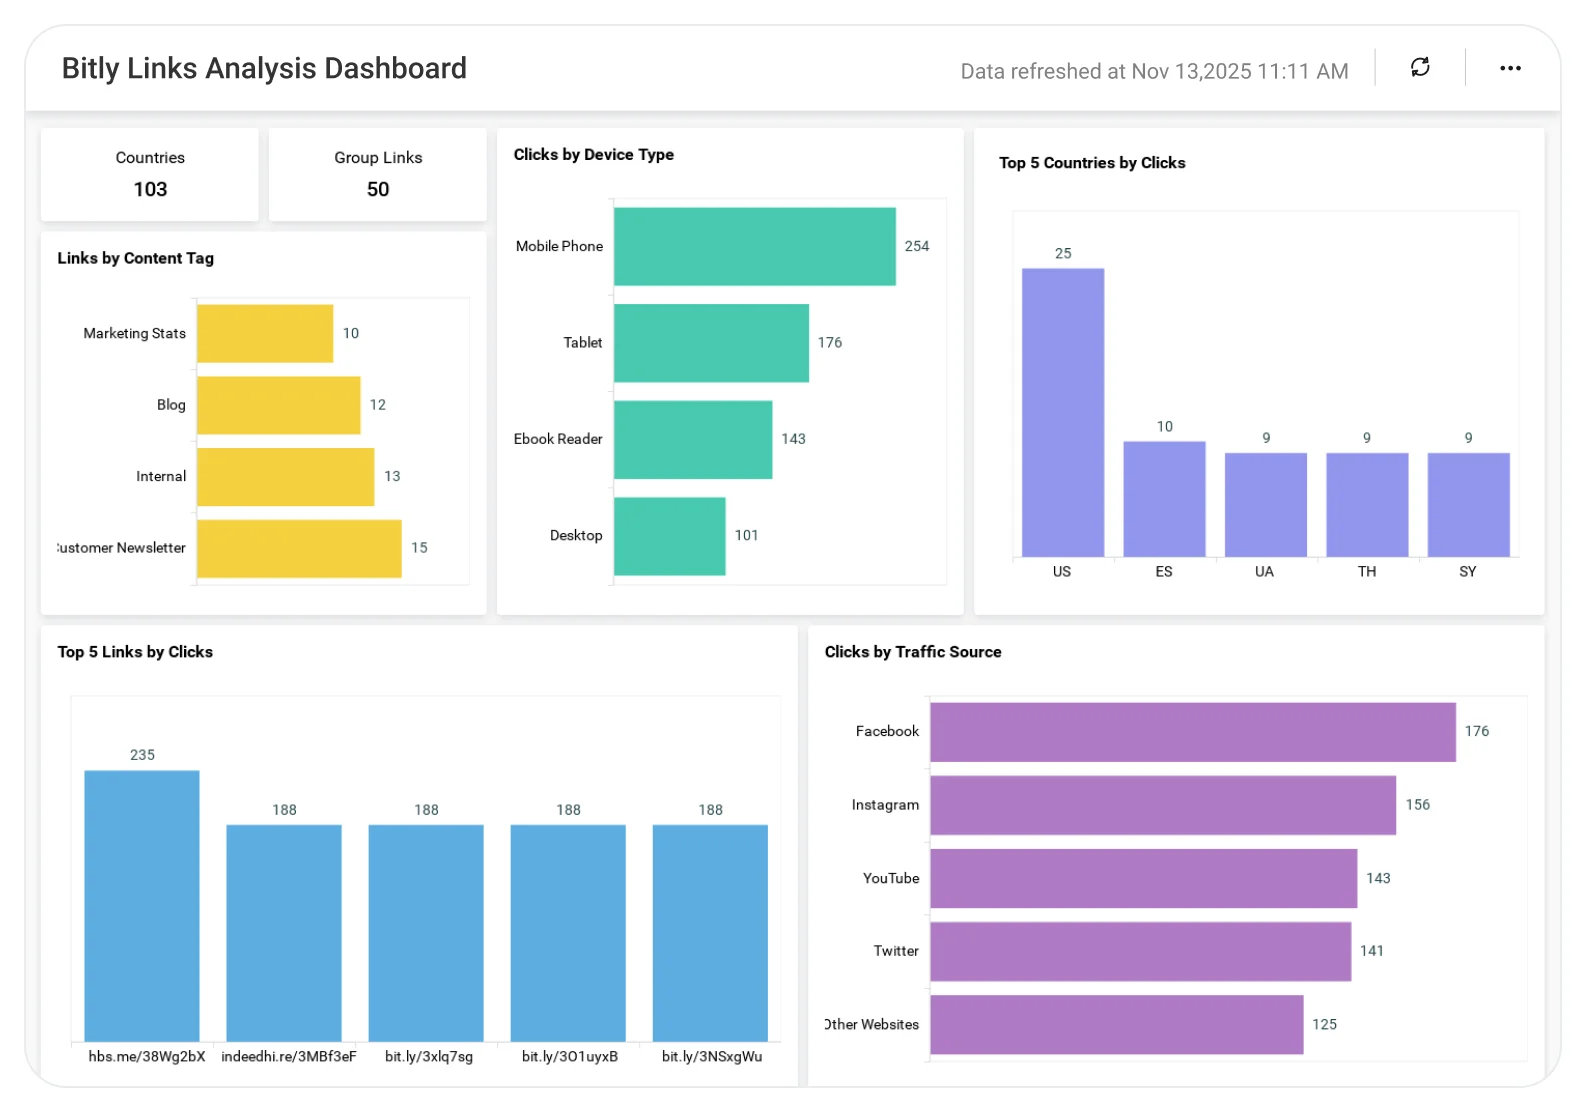
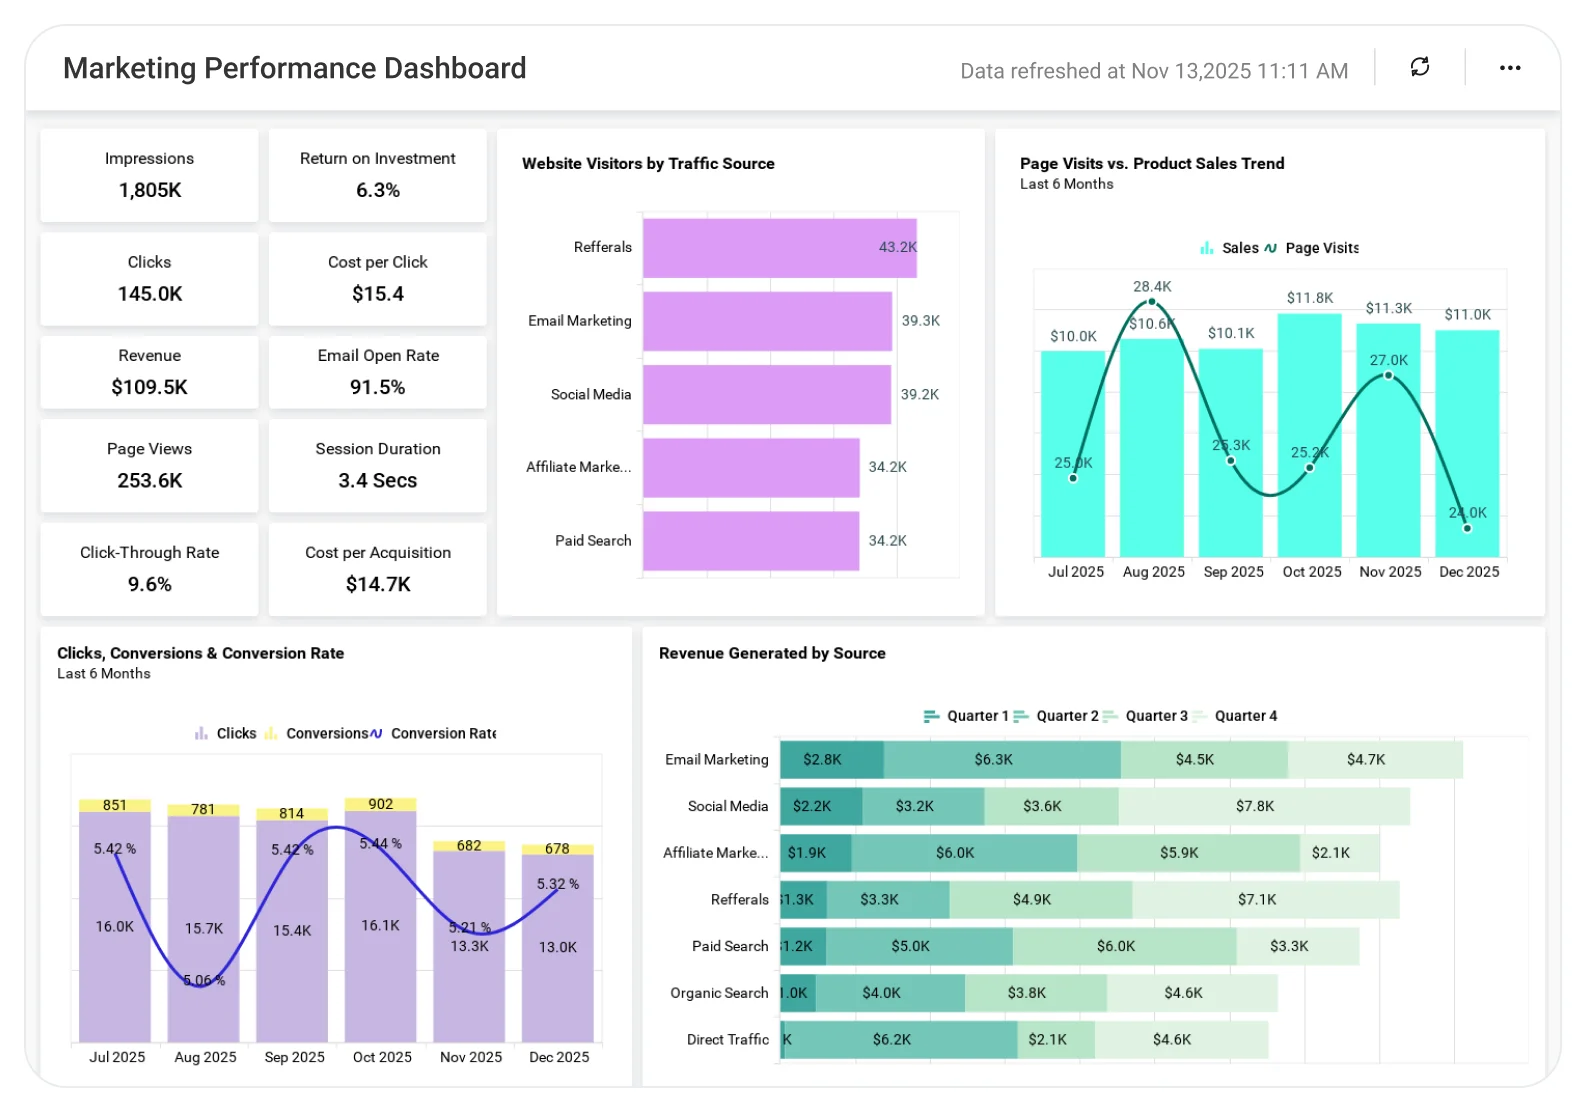
Website Traffic & Funnel Metrics: Track total visitors, leads, qualified leads, customers, and bounce rate to understand how traffic moves through the funnel.
-
Revenue by Channel & Pages: Identify which marketing and sales channels generate revenue and which landing pages contribute the most to conversions.
-
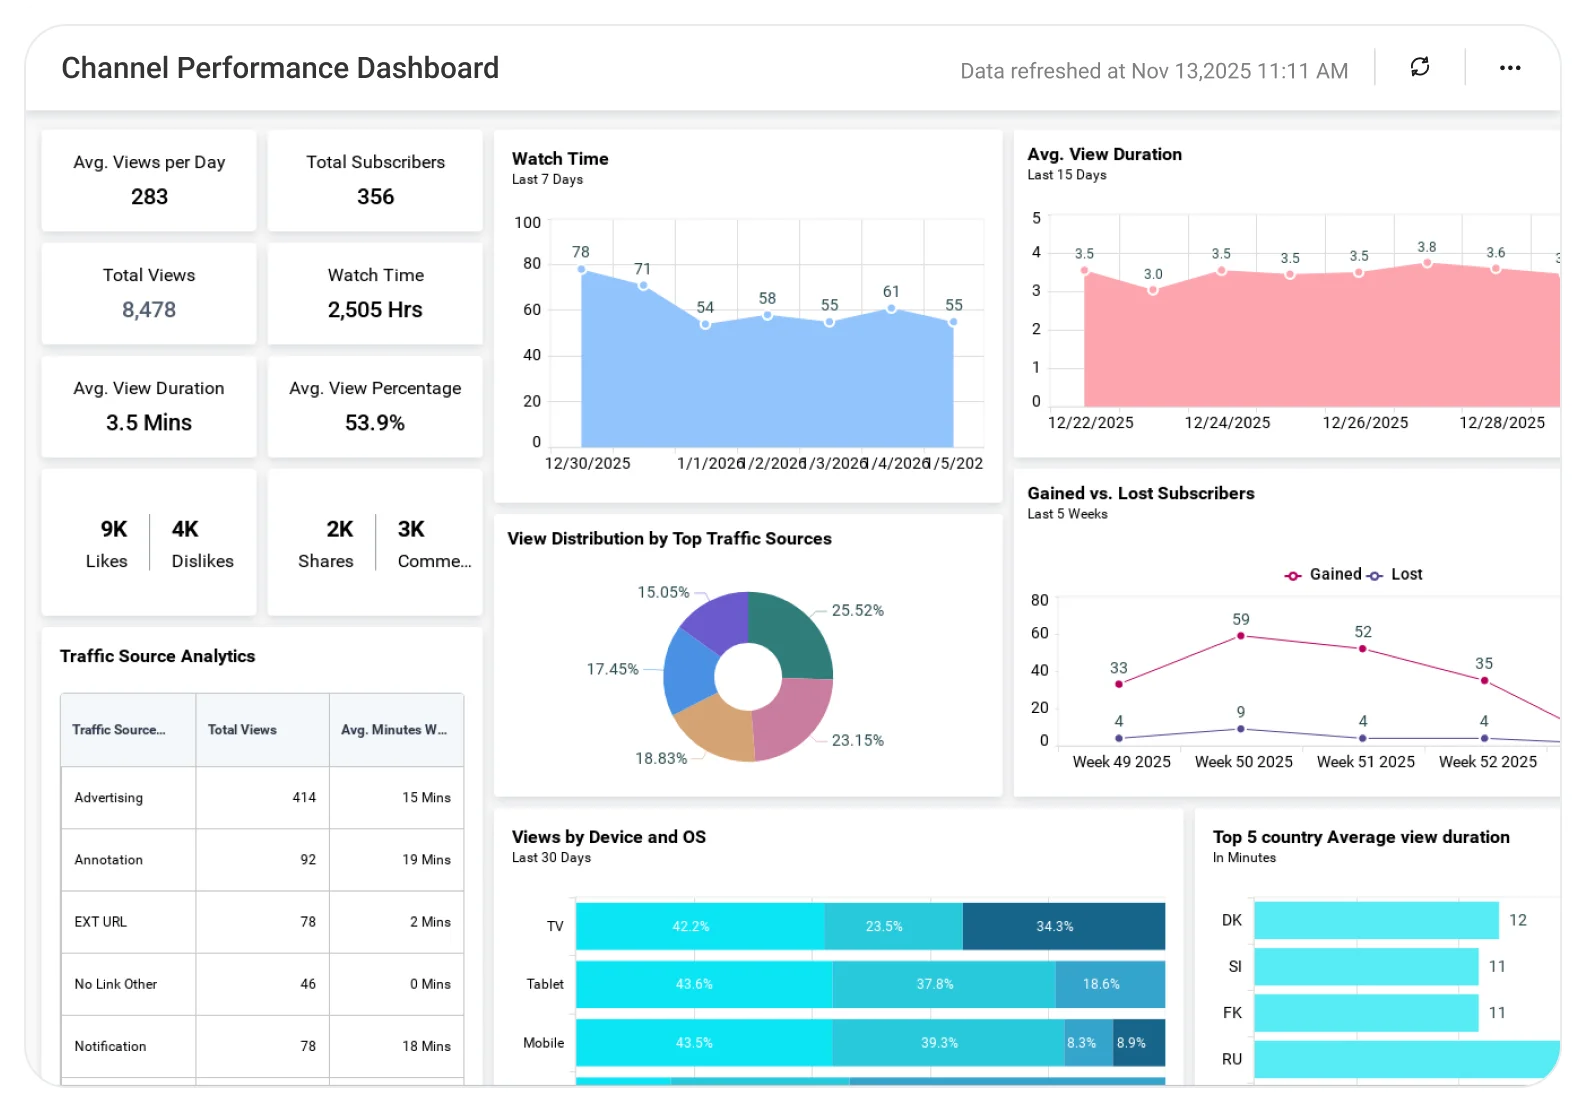
Engagement & Conversion Quality: Analyze visitor engagement, page performance, and lead quality to improve content and user experience.
-
Recurring & Long-Term Revenue Metrics: Monitor recurring revenue, ARPU, and customer lifetime value to evaluate growth and retention impact.
All dashboards are fully customizable so you can add KPIs, blend website, CRM, and revenue data, and apply filters to get a complete, revenue-focused view of website performance.
How It Works
-
Connect web analytics, CRM, and revenue data sources.
-
Apply the Website Analytics Dashboard sample.
-
Blend traffic, lead, and financial data into one view.
-
Share dashboards securely with marketing, sales, and leadership teams.
-
Act on insights to improve conversions and revenue performance.
Why Bold BI Is the Right Fit for Website Analytics
-
Unified view of websites, lead, and revenue metrics.
-
Interactive dashboards with filters and drilldowns.
-
Revenue-focused KPIs beyond basic traffic analytics.
-
Enterprise-grade security with Single Sign On, Role Based Access Control and Row Level Security.
-
Secure embedding into internal portals or analytics tools.
-
Cloud or self-hosted deployment options.
Compare Options (at a glance)
| Feature | Bold BI Website Analytics Dashboard | Built-in Analytics Tools | Spreadsheets |
| Website performance insights | Yes | Limited | Manual |
| Traffic & behavior analysis | Yes | Limited | Manual |
| Trend comparison over time | Yes | Limited | Manual |
| Interactive filtering & drilldowns | Yes | No | No |
| Sharing & embedding dashboards | Yes | Limited | No |
Frequently Asked Questions
More Articles About Website Analytics Dashboard
-
Monitor & Increase Website Traffic Using Embedded Analytics
 A detailed Bold BI blog explaining how marketing teams can embed Website Traffic & Analytics dashboards to track user behavior, sessions, bounce rate, referrals, and engagement metrics for better decision making.