Google Ads Performance Dashboard
Understand Google Ads performance to improve campaign ROI and ad efficiency.
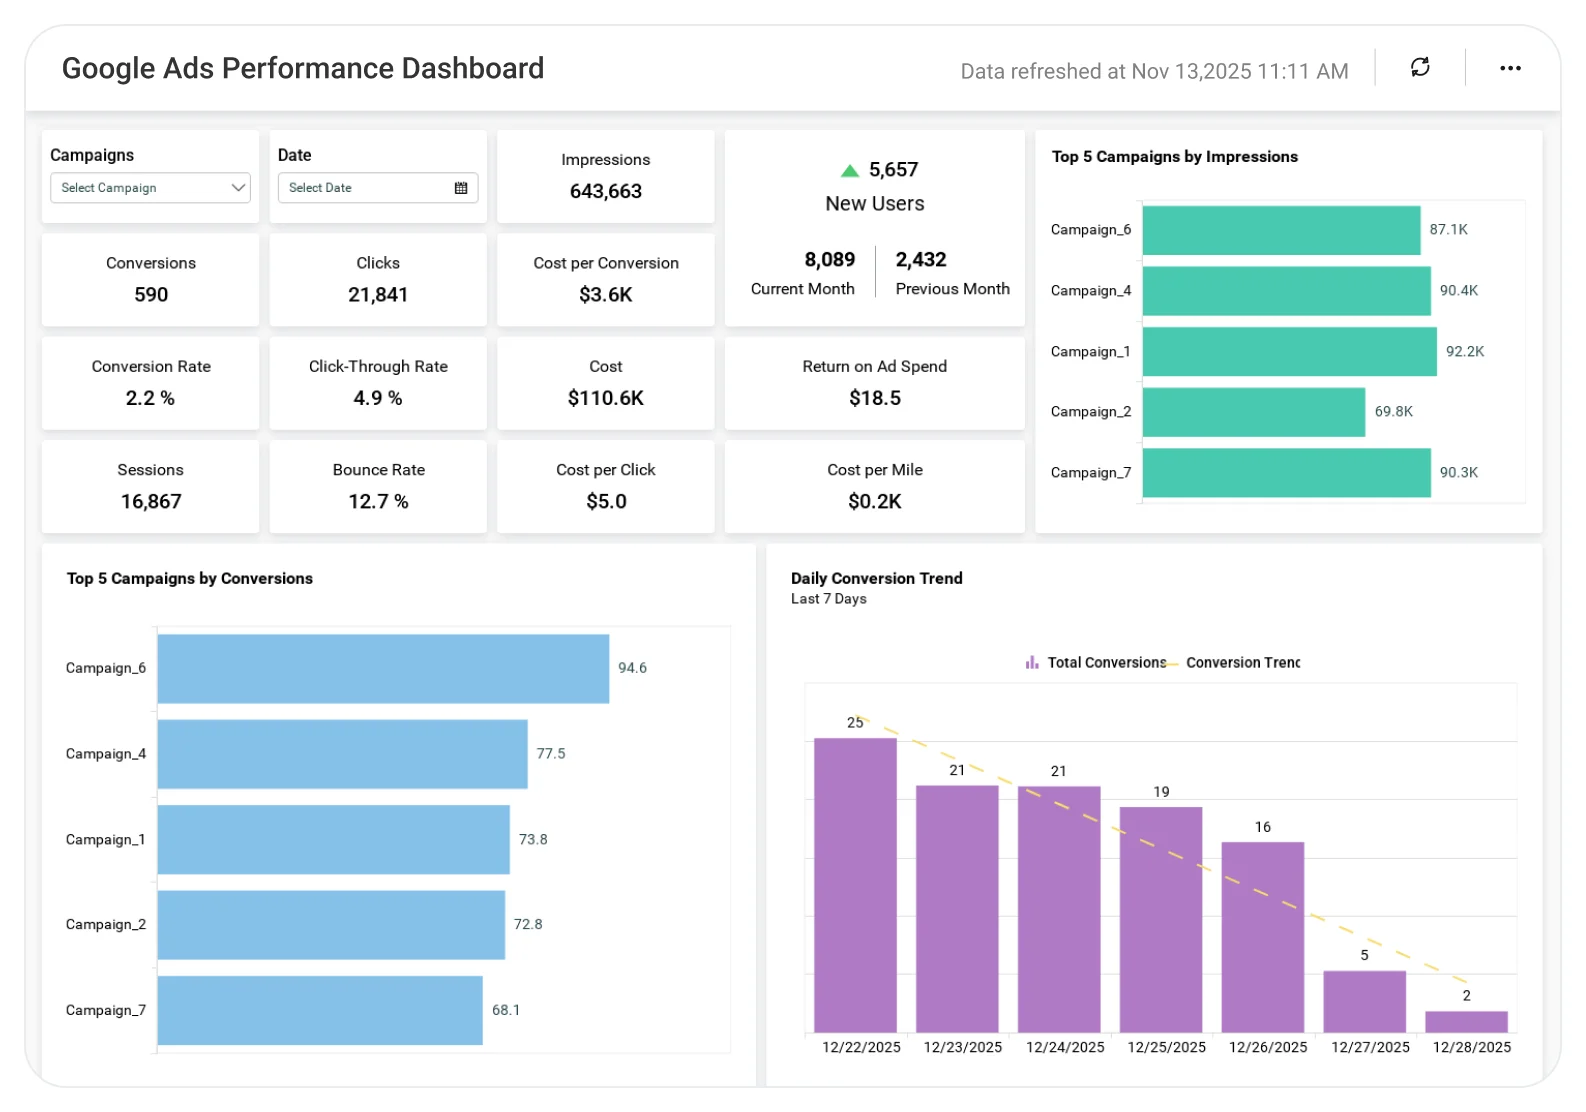
The Google Ads Performance Dashboard helps teams analyze ad spend, impressions, clicks, conversions, and keyword performance, enabling smarter bidding decisions, better budget allocation, and improved campaign results.
TL;DR:
-
Total impressions across the Google Ads network.
-
Clicks, click-through rate (CTR), and conversion rate.
-
Cost per click (CPC) and cost per conversion.
-
Revenue per click and overall ad spend.
-
Two-week performance trends.
-
Side-by-side campaign comparisons.
What is a Google Ads Performance Dashboard?
A Google Ads Performance Dashboard is a visual analytics tool that tracks ad impressions, clicks, conversions, costs, and revenue from Google Ads.
In Bold BI, it becomes an interactive dashboard with drilldowns, filters, and trend analysis, thereby helping teams optimize ad spend and maximize ROI using real-time data.
Why Google Ads Performance Dashboard Matters
Running Google Ads without clear visibility into performance often leads to wasted spend and missed opportunities.
With Google Ads Performance Dashboard, marketing leaders can quickly answer:
-
How many times are our ads shown across Google’s network?
-
How many clicks are we getting, and what is our CTR?
-
What is our conversion rate across campaigns?
-
How much does each click and conversion cost us?
-
Are we generating enough revenue per click to justify spending?
Bold BI brings all these answers into one dashboard with no spreadsheets or fragmented reports required.
What You’ll Track
Using Bold BI dashboards, you will track important project overview KPIs such as:
-
Ad visibility & traffic: Monitor impressions, clicks, CTR, sessions, and new users.
-
Conversion performance: Track conversions and conversion rates across campaigns.
-
Cost efficiency metrics: Analyze cost per click and cost per conversion to control spend.
-
Revenue impact: Measure revenue per click and overall campaign ROI.
All dashboards are fully customizable so you can add KPIs or metrics as needed.
How It Works
-
Connect Google Ads, or exported Excel/SQL and supporting marketing data sources.
-
Apply the Google Ads Performance Dashboard sample.
-
Blend traffic, conversion, and revenue data for complete insight.
-
Share dashboards securely with marketing teams and leadership.
-
Act on insights to improve ad performance and ROI.
Why Bold BI Is the Right Fit for Google Ads Performance Analytics
The KPI card widgets at the top of the dashboard provide an instant snapshot of campaign health.
Teams can monitor:
-
Impressions, clicks, and conversions.
-
Sessions and new users driven by ads.
-
Overall ad spend.
-
Cost per click (CPC) and cost per conversion.
-
Revenue per click.
Compare Options (at a glance)
| Feature | Bold BI | Google Ads Native Reports | Spreadsheets / Manual Reporting |
|---|---|---|---|
| Campaign performance (spend, clicks, CTR, CPC, conversions) | Yes | Yes | Manual |
| Keyword & search term insights | Yes | Yes (with limits) | Manual |
| Audience & device breakdowns | Yes | Yes | Manual |
| Conversion value & ROAS tracking | Yes | Partial (often needs customization) | Manual |
| Custom KPIs & dashboards | Fully customizable | Limited/custom | Manual |
Frequently Asked Questions
More Articles About Google Ads Performance Dashboard
-
Boost Google Ads Performance with Data Visualization
 This blog explains how using data visualization and business intelligence (BI) dashboards can help marketers better analyze and optimize Google Ads campaigns to improve performance, insights, and return on investment (ROI).
-
Monitoring Ad Performance in a Google Ads Dashboard
This blog explains how marketers can use a Google Ads performance dashboard to track and monitor key advertising metrics in one place, helping them make smarter decisions and improve campaign outcomes.