

Hotel Revenue Management Dashboard
Improve hotel profitability by analyzing revenue performance across rooms, channels, and time periods.
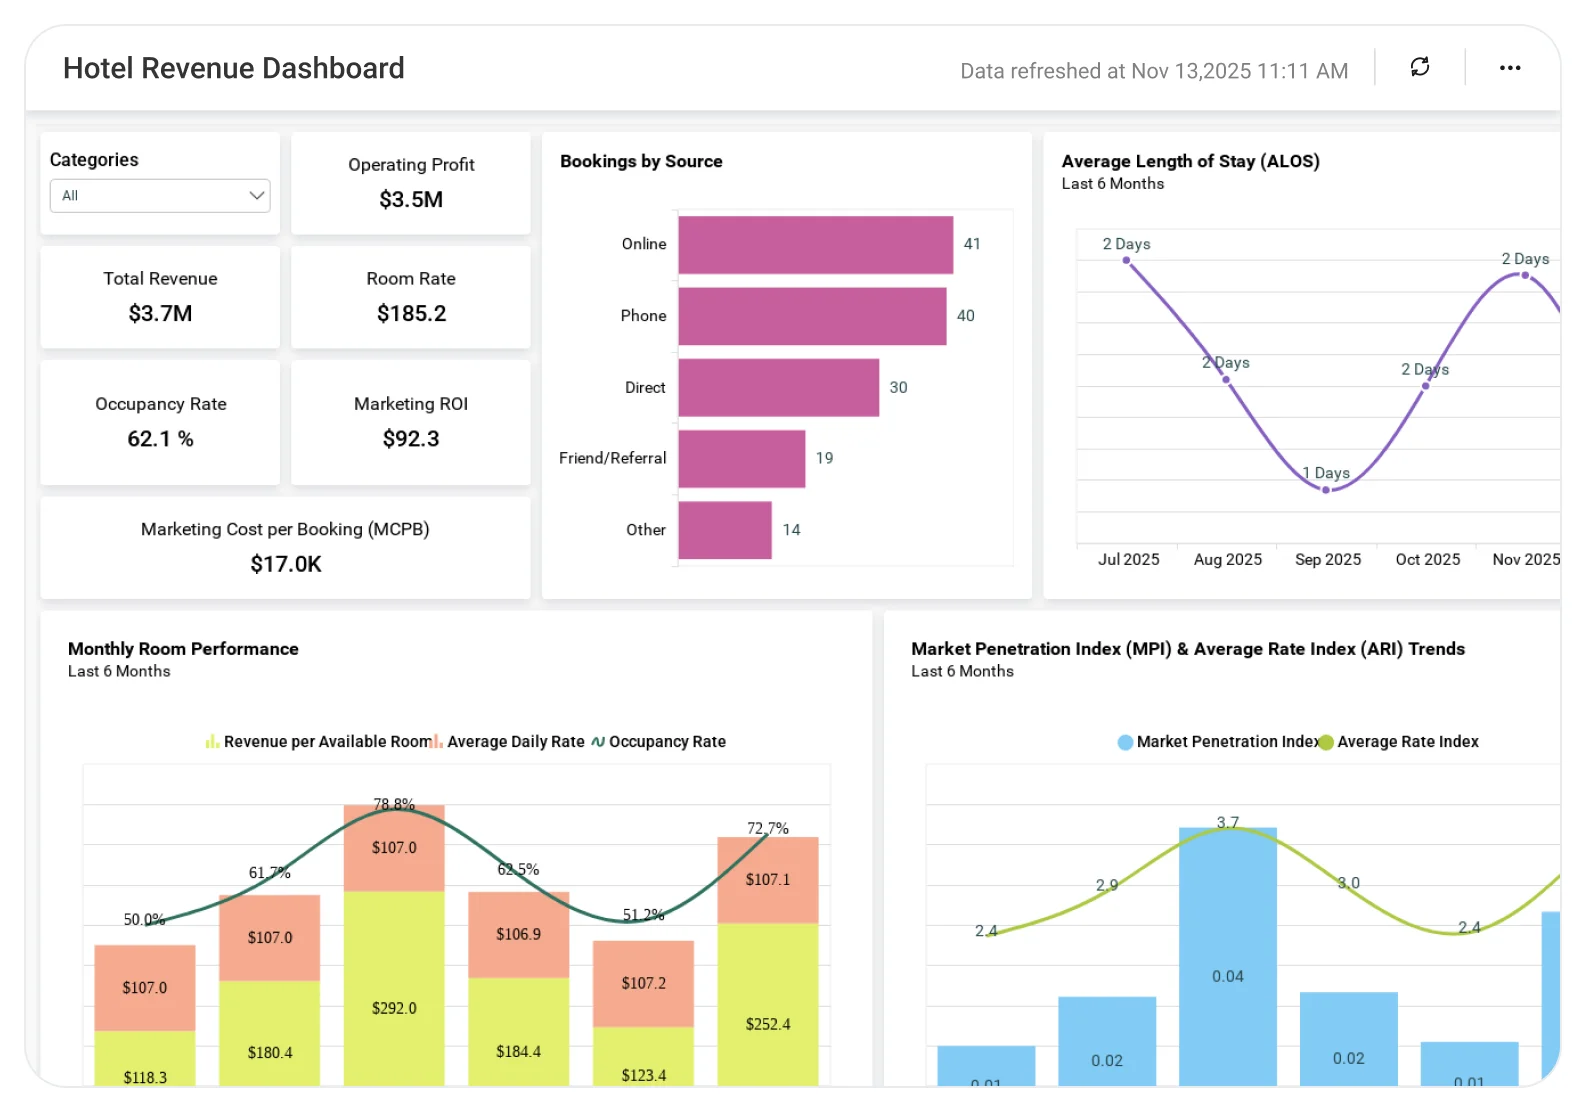
The Hotel Revenue Dashboard helps hospitality teams evaluate occupancy, ADR, RevPAR, and booking trends, enabling smarter pricing strategies, better demand planning, and increased revenue outcomes.
TL;DR
Everything revenue managers need, live in one dashboard.
-
Revenue Performance :Total revenue and year-over-year trends.
-
Regional Insights : Interactive revenue comparison by location.
-
Booking Channels : Online, direct, and agent booking mix.
-
Occupancy by Room Type : Identify underutilized inventory.
-
Revenue KPIs : RevPAR, ADR, OCC, and ARI in one view.
What Is a Hotel Revenue Management Dashboard?
A Hotel Revenue Management Dashboard is a visual analytics tool that tracks hotel revenue, occupancy, pricing, and booking behavior to support smarter pricing and capacity decisions.
In Bold BI, this includes interactive charts that show revenue trends, booking sources, RevPAR, ADR, and occupancy rates, all updated automatically.
Why Hotel Revenue Management Dashboard Matters
Hotel performance depends on multiple moving parts, including pricing, demand, occupancy, and booking behavior.
Without a centralized dashboard:
-
Revenue trends are hard to compare across regions.
-
Pricing decisions rely on guesswork.
-
Marketing spend isn’t aligned with booking behavior.
-
Occupancy issues are identified too late.
Bold BI replaces fragmented reports with a real‑time, visual source of truth, enabling revenue teams to act before missed revenue opportunities appear.
What You’ll Track
-
Revenue performance & regional trends: Total revenue, regional contribution, and year-over-year growth with interactive filtering.
-
Booking sources & channel mix: Online, direct, and agent bookings with visibility into peak demand periods.
-
Occupancy by room category: Utilization levels across room types to highlight under- or over-performing inventory.
-
Revenue efficiency metrics: RevPAR, ADR, OCC, and ARI displayed together to support pricing decisions.
-
Performance alignment insights: Understand how revenue, pricing, and occupancy work together to optimize hotel performance.
All dashboards are fully customizable, allowing you to add KPIs or metrics as needed.
How It Works
Why Bold BI Is the Right Fit for Hotel Revenue Analytics
-
Unified hospitality performance view: Track revenue, bookings, and occupancy in one centralized dashboard.
-
Deep drilldowns for better decisions: Navigate from regional performance down to property- and room-level insights.
-
Smarter pricing & occupancy management: Analyze ADR, occupancy trends, and room utilization to optimize pricing and improve fill rates.
-
Channel & marketing optimization: Visualize booking sources and revenue contribution to focus marketing spend where it performs best.
-
Proactive planning: Use historical trends to anticipate seasonal demand and plan capacity effectively.
-
Secure & embeddable analytics: Share dashboards securely using Row Level Security(RLS), Single Sign On(SSO), and Role Based Access Control(RBAC), and embed them into hotel portals or internal tools.
-
Flexible deployment: Deploy dashboards securely in cloud or self-hosted environments to suit hospitality IT needs.
Compare Options (at a glance)
| Feature | Bold BI | Hotel Reports | Spreadsheets |
| Revenue & occupancy tracking | Yes | Partial | Manual |
| Booking source analytics | Yes | Limited | Manual |
| RevPAR & ADR insights | Yes | Static | Manual |
| Regional filtering | Interactive | Fixed | Manual |
| Deployment | Cloud / self-hosted | SaaS only | Local |
Frequently Asked Questions
More Articles About Hotel Revenue Management
-
Visualizing Success: Maximizing Hotel Revenue Through Data Insights
 Highlights how data visualization and interactive KPI tracking (e.g., RevPAR, MPI, ARI) in Bold BI can drive informed pricing and occupancy improvements. Covers booking sources, segmentation, and efficiency metrics.
-
Expand Your Hospitality Business with Embedded Analytics
Discusses integrating Bold BI analytics within PMS and hotel applications, enabling real-time tracking of bookings, occupancy, and operational performance.


