Travel Agency Tour Performance Dashboard
Improve tour profitability, optimize inventory planning, and drive smarter growth decisions through unified tour performance insights.
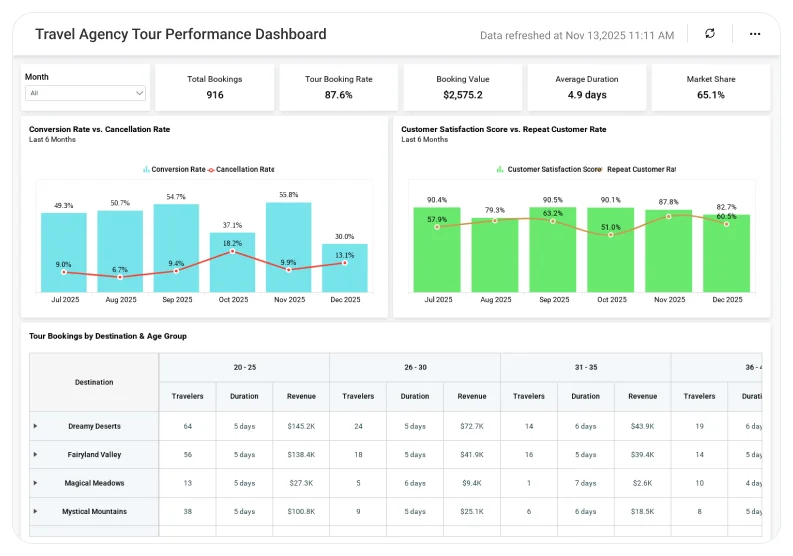
The Travel Agency Tour Performance Dashboard helps travel operators analyze bookings, revenue, cancellations, and tour performance across destinations, supporting better pricing, demand planning, and partner decisions.
TL;DR
-
Track overall tour booking volume and revenue trends to understand demand and growth.
-
Identify top- and low-performing tours by destination and category to optimize offerings.
-
Monitor booking, cancellation, and refund patterns to reduce revenue leakage.
-
Analyze revenue contribution by tour, channel, and time period to improve pricing decisions.
-
Support smarter inventory, pricing, and growth planning with data-driven tour performance insights.
What Is a Travel Agency Tour Performance Dashboard?
A Travel Agency Tour Performance Dashboard is an analytics solution that provides a consolidated view of how tours perform across the booking lifecycle, from demand and conversion to revenue realization and cancellations.
With Bold BI, tour data from booking systems, marketplaces, CRM platforms, and finance tools is unified into interactive dashboards, helping travel agencies move from reactive reporting to proactive tour and inventory optimization.
Why Travel Agency Tour Performance Dashboard Matters
Tour performance directly impacts revenue growth, customer satisfaction, and operational efficiency.
When tour data is spread across booking platforms and spreadsheets:
-
High-demand tours are under-optimized.
-
Poor-performing packages remain unnoticed.
-
Cancellation trends are identified too late.
-
Pricing and inventory decisions rely on assumptions.
A centralized tour performance dashboard helps agencies compare destinations and packages using consistent, real-time data.
What You’ll Track
Using Bold BI dashboards, you will track important KPIs such as:
-
Tour booking volume: Number of bookings by tour, destination, or period to understand demand patterns.
-
Revenue & average booking value: Revenue contribution and booking value by tour to assess profitability.
-
Cancellation & refund rates: Booking cancellations and refunds to identify risk areas and policy impact.
-
Tour-wise performance comparison: Side-by-side performance of tours to identify winners and underperformers.
All dashboards are fully customizable, allowing you to add KPIs or metrics as needed.
How It Works
-
Apply the Travel Agency Tour Performance Dashboard sample.
-
Combine booking, revenue, and cancellation data into a unified model.
-
Analyze insights by tour, destination, channel, or time period.
-
Share dashboards with commercial, operations, and leadership teams.
Why Bold BI Is the Right Fit for Tour Performance & Travel Analytics
-
Clarifies which tours truly drive revenue and margin: Separates high-volume bookings from high-value tours, helping teams focus on profitable offerings.
-
Improves demand and inventory planning across destinations: Highlights seasonal patterns and demand shifts to optimize tour availability and scheduling.
-
Reduces revenue leakage from cancellations and refunds: Surfaces cancellation trends early, enabling policy adjustments and better customer communication.
-
Supports faster commercial and pricing decisions: Provides a single view for revenue, demand, and performance used in daily or weekly revenue huddles.
-
Scales across multi-destination and multi-tour portfolios: Designed for agencies managing large catalogs of tours across regions and markets.
Compare Options (at a glance)
| Feature | Bold BI | Booking System Reports | Spreadsheets |
| Tour performance analytics | Yes | Limited | Manual |
| Revenue & booking trend insights | Yes | Partial | Manual |
| Cancellation & refund analysis | Yes | Limited | Manual |
| Destination-level comparison | Yes | Limited | Manual |
| Custom KPIs & drilldowns | Fully customizable | Fixed | Manual |