

Production Monitoring Dashboard
Improve manufacturing efficiency by analyzing production performance and identifying process bottlenecks.
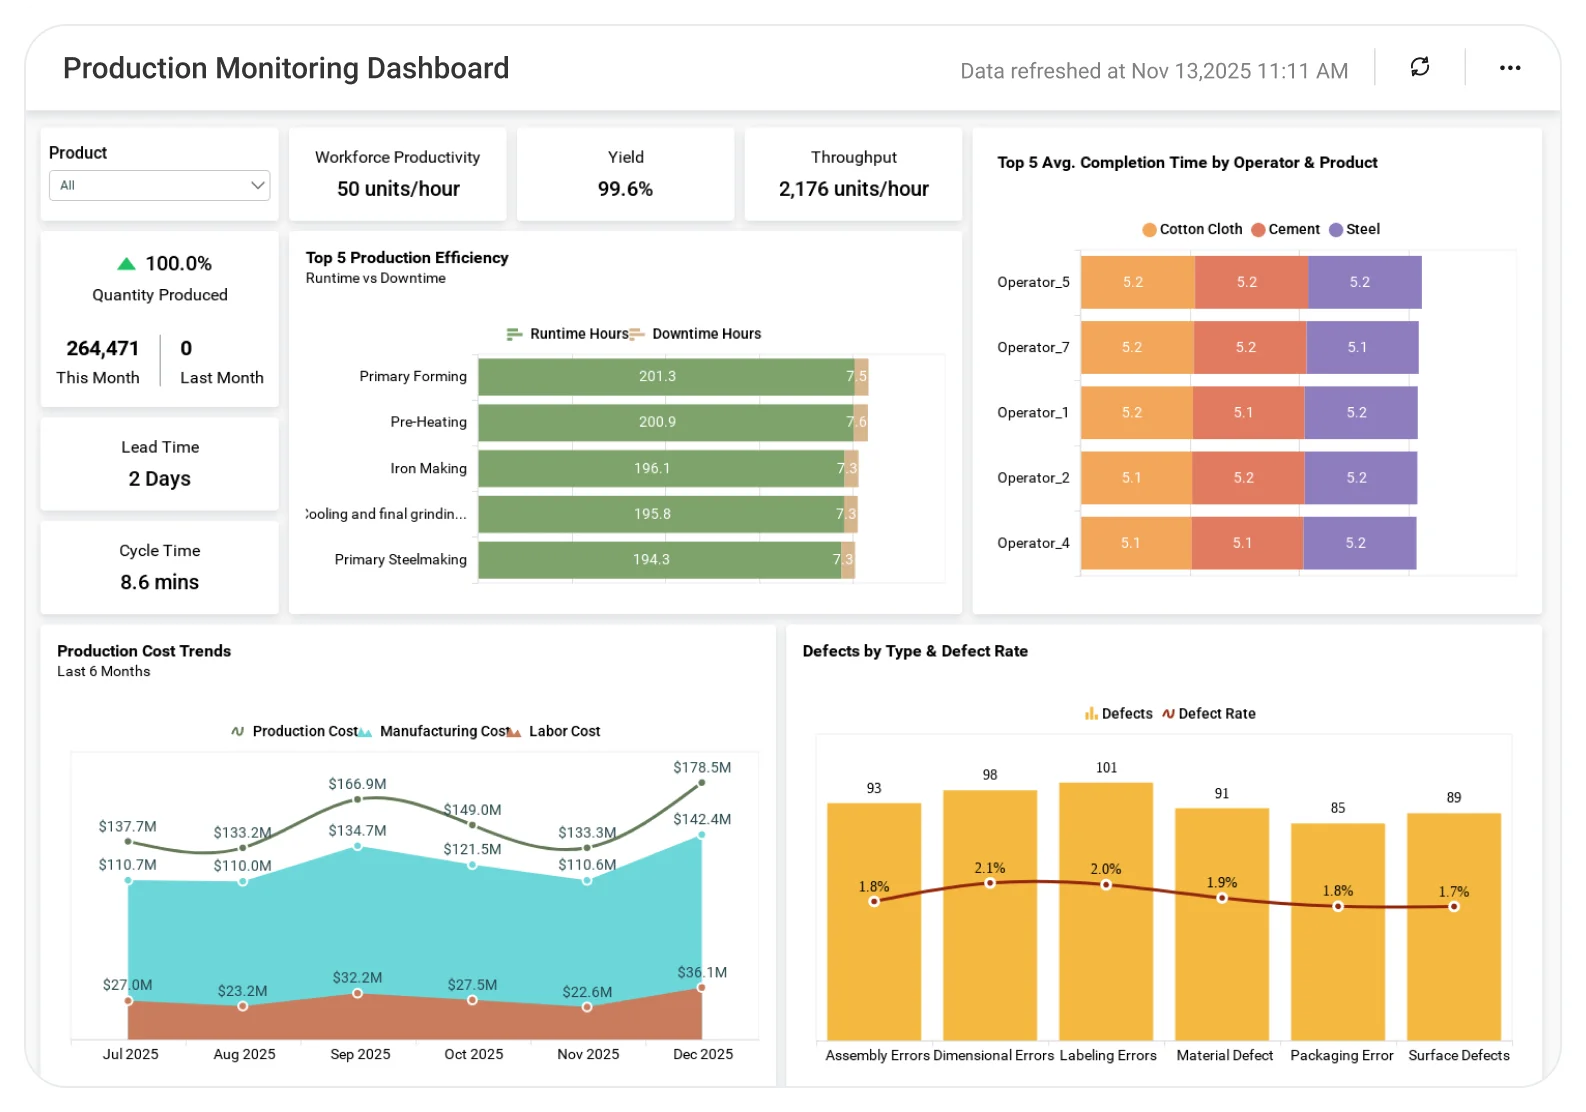
The Production Dashboard helps operations teams evaluate output, downtime, and throughput across lines, enabling faster issue resolution, higher productivity, and consistent production outcomes.
TL;DR
-
Production output : Target vs. actual, shift and hourly performance.
-
Equipment performance : OEE, run time vs. downtime.
-
Cost metrics : Unit cost, labor trends, material usage.
-
Quality insights : Rework, scrap, and defect trends.
-
Interactive analysis : Drill by product, line, shift, or date.
What Is a Production Monitoring Dashboard?
It provides a real-time, data-driven view of plant output, equipment efficiency, downtime, and manufacturing cost.
In Bold BI, this translates into unified visualizations such as production KPIs, OEE indicators, downtime charts, rework trends, cost analysis, and machine-level insights, all powered by connected manufacturing systems.
Operations teams can detect issues instantly, optimize resource usage, and reduce production losses.
Why Production Monitoring Dashboard Matters
Production performance can shift from hour to hour. Without real-time visibility, issues such as downtime, quality defects, or missed targets are often identified too late, resulting in lost output and higher costs.
A production monitoring dashboard provides teams with a live view of output, equipment performance, and bottlenecks. This helps them respond quickly, keep production on track, and continuously improve efficiency
What You’ll Track
Using Bold BI dashboards, you will track important KPIs such as:
-
Output & Production Flow: Real-time production counts, target vs. actual output, rework quantity, and shift-level performance.
-
Equipment Efficiency & Downtime: Machine run time vs. downtime, availability, performance, quality, and OEE for identifying bottlenecks.
-
Cost & Labor Metrics: Manufacturing cost per unit, labor cost trends, material usage, and cost distribution across processes or lines.
-
Process & Product Performance: Efficiency across products, production lines, and processes including scrap, defect trends, and cycle-time variations.
All dashboards are fully customizable, allowing you to add KPIs or metrics as needed.
How It Works
-
Choose the Production Monitoring Dashboard sample.
-
Blend production, equipment, maintenance, and cost data.
-
Share role-based views for supervisors, maintenance teams, and executives.
-
Create alerts for rising downtime, low OEE, or cost anomalies.
Why Bold BI Is the Right Fit for Production Monitoring Analytics
-
Unified manufacturing visibility: Bring production, maintenance, quality, and financial KPIs into one centralized dashboard.
-
Deep operational drilldowns: Drill from plant → line → machine → shift to quickly identify bottlenecks and downtime causes.
-
Real-time performance insights: Monitor production targets, equipment utilization, downtime, rework, and scrap trends as they happen.
-
Actionable cost & efficiency analysis: Understand how machine performance impacts labor, cost, and long-term operational efficiency.
-
Secure & governed access: Share insights safely using Row Level Security(RLS), Single Sign On(SSO), Role Based Access Control(RBAC), and audit logs.
Compare Options (at a glance)
| Feature | Bold BI | MES/SCADA Standard Reports | Spreadsheets |
|---|---|---|---|
| Real-time production throughput & output trends | Yes | Limited | Manual |
| OEE (Availability, Performance, Quality) tracking | Yes | Partial | Manual |
| Downtime analysis (reason codes, duration, MTTR/MTBF) | Yes | Limited | Manual |
| Scrap, defects & yield analysis | Yes | Partial | Manual |
| Line/cell/shift performance comparisons | Yes | Limited | Manual |
| Cycle time, takt time & bottleneck identification | Yes | Limited | Manual |
| Custom KPIs & dashboards | Fully customizable | Fixed | Manual |
Frequently Asked Questions
More Articles About Production Monitoring Dashboard
-
Top 5 Dashboard Reporting Tools Every Business Should Use
 This blog explores essential reporting tools that enable businesses to visualize production data and enhance operational efficiency.
-
Effectively Monitor Your Company’s Production Using Embedded Analytics
This blog shows how embedded analytics provides real-time insights to track production of KPIs and optimize workflows.
-
AI for Data Analytics: Benefits, Best Practices & Use Cases
This blog explores how AI enhances data analytics for production monitoring, enabling predictive insights, and informed decisions.


