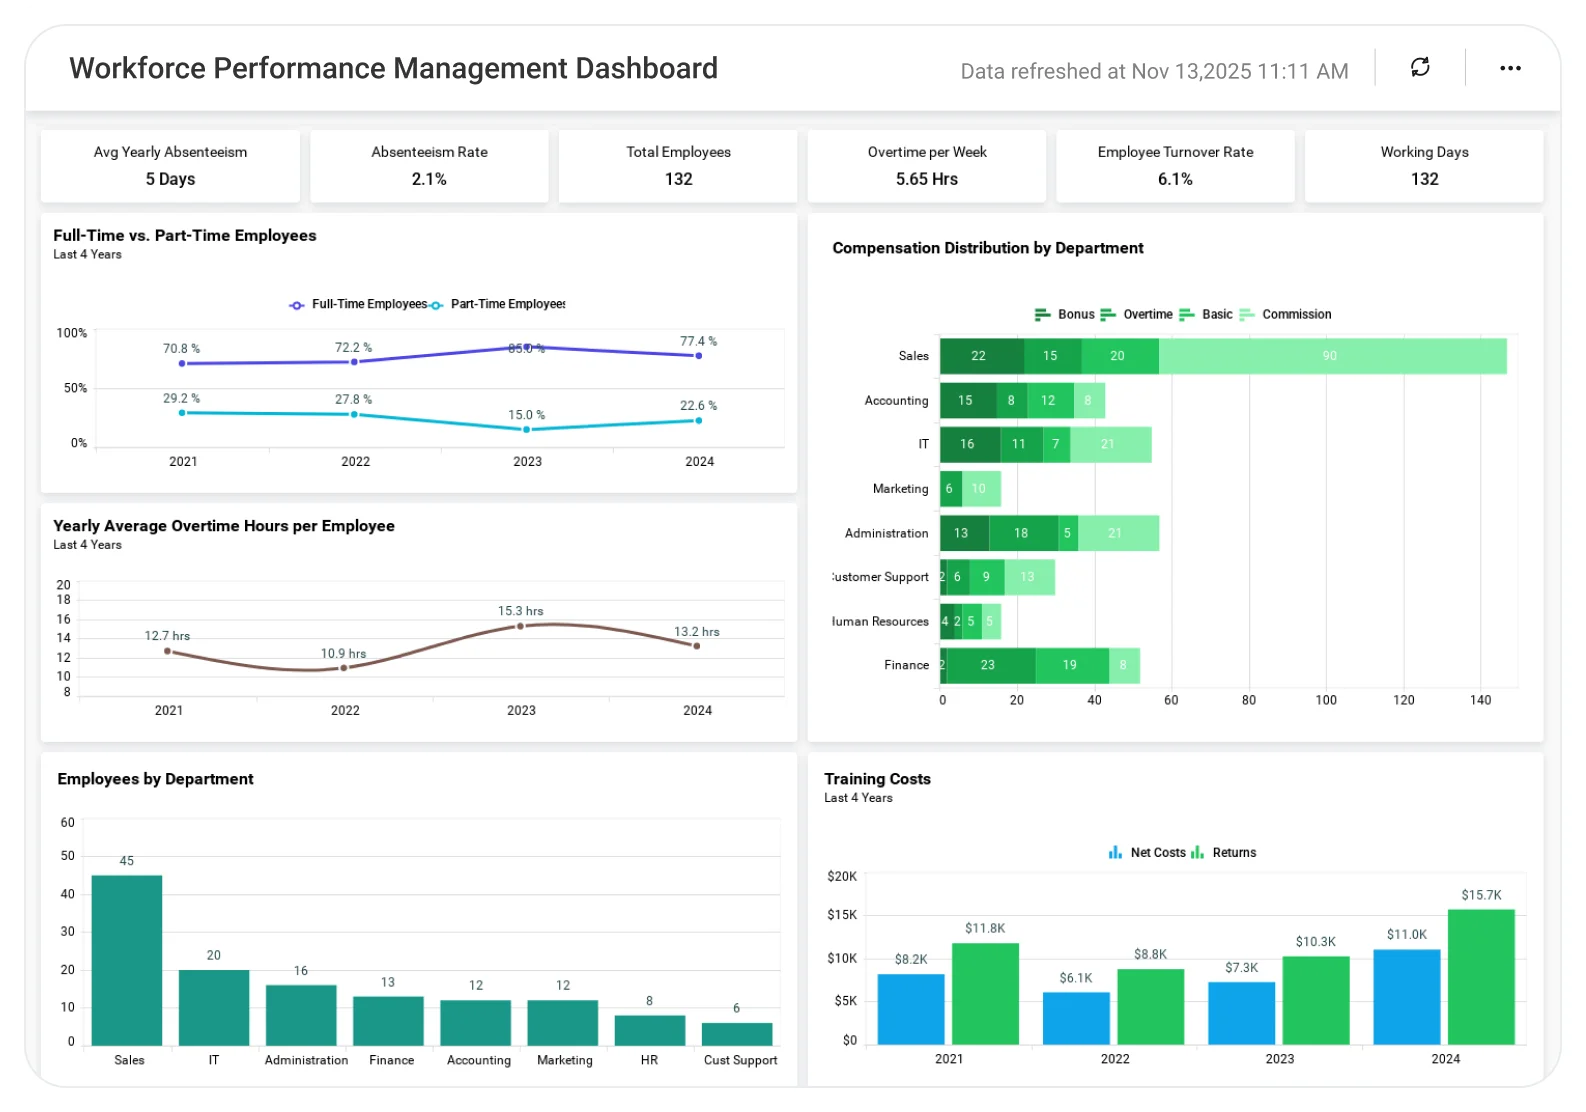
Workforce Performance Management Dashboard
Understand workforce performance to improve productivity and align employee efforts with business goals.
The Workforce Performance Dashboard helps HR and business leaders analyze employee performance metrics, productivity trends, and goal achievement, enabling better workforce planning, performance improvement, and informed people decisions.
TL;DR
-
Employee performance ratings (1–5) distribution.
-
Workforce demographics such as age and tenure.
-
Headcount by department and employment status.
-
Absenteeism trends and workforce stability metrics.
-
Searchable employee-level performance details.
What Is a Workforce Performance Management Dashboard?
A Workforce Performance Management Dashboard is a visual analytics tool that tracks employee performance, demographics, stability, and engagement across an organization.
In Bold BI, this means interactive KPIs, charts, and tables that help HR leaders evaluate workforce health at both high-level and individual employee detail.
Why Workforce Performance Dashboard Matters
Employees are one of the most valuable and costly assets of any organization.
Without workforce analytics:
-
Performance issues remain hidden.
-
Attrition and absenteeism rise quietly.
-
Diversity and workforce balance are hard to track.
-
Hiring and workforce planning lack data support.
Bold BI provides a single, clear view of workforce performance, helping HR teams improve talent quality, reduce risk, and support long-term organizational goals.
What You’ll Track
-
Employee performance & quality: Track employee count by performance rating to assess overall workforce quality and improvement needs.
-
Tenure, age & absenteeism: Monitor average employee tenure, workforce age distribution, and monthly absenteeism rates.
-
Department & employment status: Analyze headcount by department and employment type (full-time vs. part-time).
-
Employee-level workforce data: Search and filter detailed employee records including department, hire date, experience, and contact details.
All dashboards are fully customizable so you can add KPIs or metrics as needed.
How It Works
-
Apply the Workforce Performance Management Dashboard sample.
-
Interact with department-level charts to update all metrics dynamically.
-
Search & filter employee records directly from tables.
-
Share role-based dashboards with HR leaders and executives.
Why Bold BI Is the Right Fit for Workforce Performance Analytics
Bold BI is built for modern, data-driven HR teams.
With Bold BI, you can:
-
Comprehensive workforce visibility: Monitor employee performance, workforce quality, absenteeism, and stability from a single dashboard.
-
Talent and performance insights: Identify low-performance trends early and focus on targeted development and improvement initiatives.
-
Workforce mix & diversity analysis: Analyze tenure, age, experience, gender balance, and employment type (full-time vs. part-time) across teams.
-
Better planning & decision-making: Use workforce trends to support strategic hiring, capacity planning, and long-term workforce growth.
-
Secure and flexible deployment: Deploy dashboards in the cloud or self-hosted environments with enterprise-grade security.
Compare Options (at a glance)
| Feature | Bold BI | Hotel Reports | Spreadsheets |
| Performance rating analysis | Yes | Partial | Manual |
| Workforce demographics | Yes | Limited | Manual |
| Absenteeism tracking | Yes | Partial | Manual |
| Employee-level drilldowns | Interactive | Limited | Manual |
| Deployment | Cloud / self-hosted | SaaS only | Local |
Frequently Asked Questions
More Articles About Workforce Management Dashboard
-
Ease Your Workforce Management with Embedded Analytics
 A Bold BI blog illustrating how HR teams can leverage embedded analytics within their applications to handle workforce challenges covering hiring practices, employee performance monitoring, satisfaction metrics, and churn reduction through interactive dashboards.
-
Facilitate HR Recruitment and Workforce Performance Using Talent Analytics in Bold BI
This Medium post shows how talent analytics dashboards in Bold BI help HR teams improve recruitment and workforce performance by identifying high-performing employees and relevant traits in job candidates.