What Is a Website Traffic Dashboard? (Quick Answer)
A Website Traffic Dashboard is a real-time, data-driven view of your website visitors, acquisition channels, engagement patterns, and geographic reach.
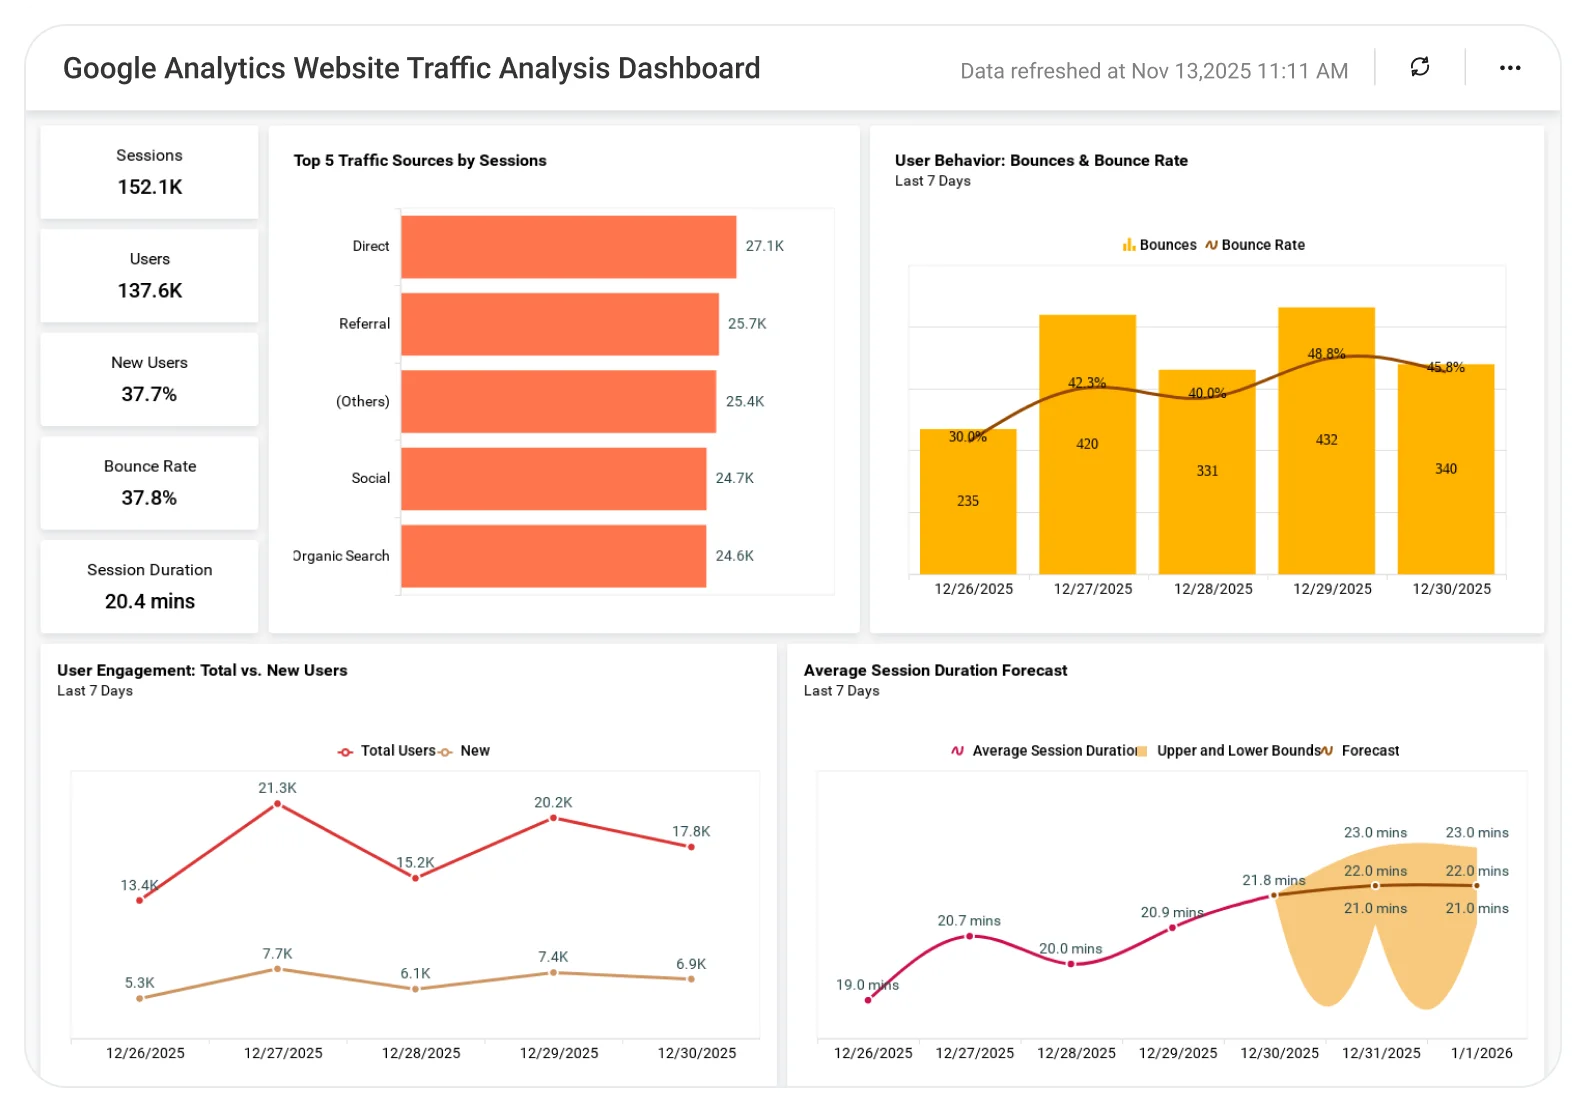
In Bold BI, that means unified visualizations—user count cards, session KPIs, bounce-rate gauges, geo-distribution maps, traffic-source charts, session-duration trends, and forecast models—all powered by connected marketing data.
Marketing teams can instantly understand what’s working, what’s not, and where to optimize next.


 Learn how to monitor conversions and traffic sources in a single dashboard for better marketing decisions.


