Google Analytics Page Performance Dashboard
Understand page-level performance to improve content effectiveness and user engagement.
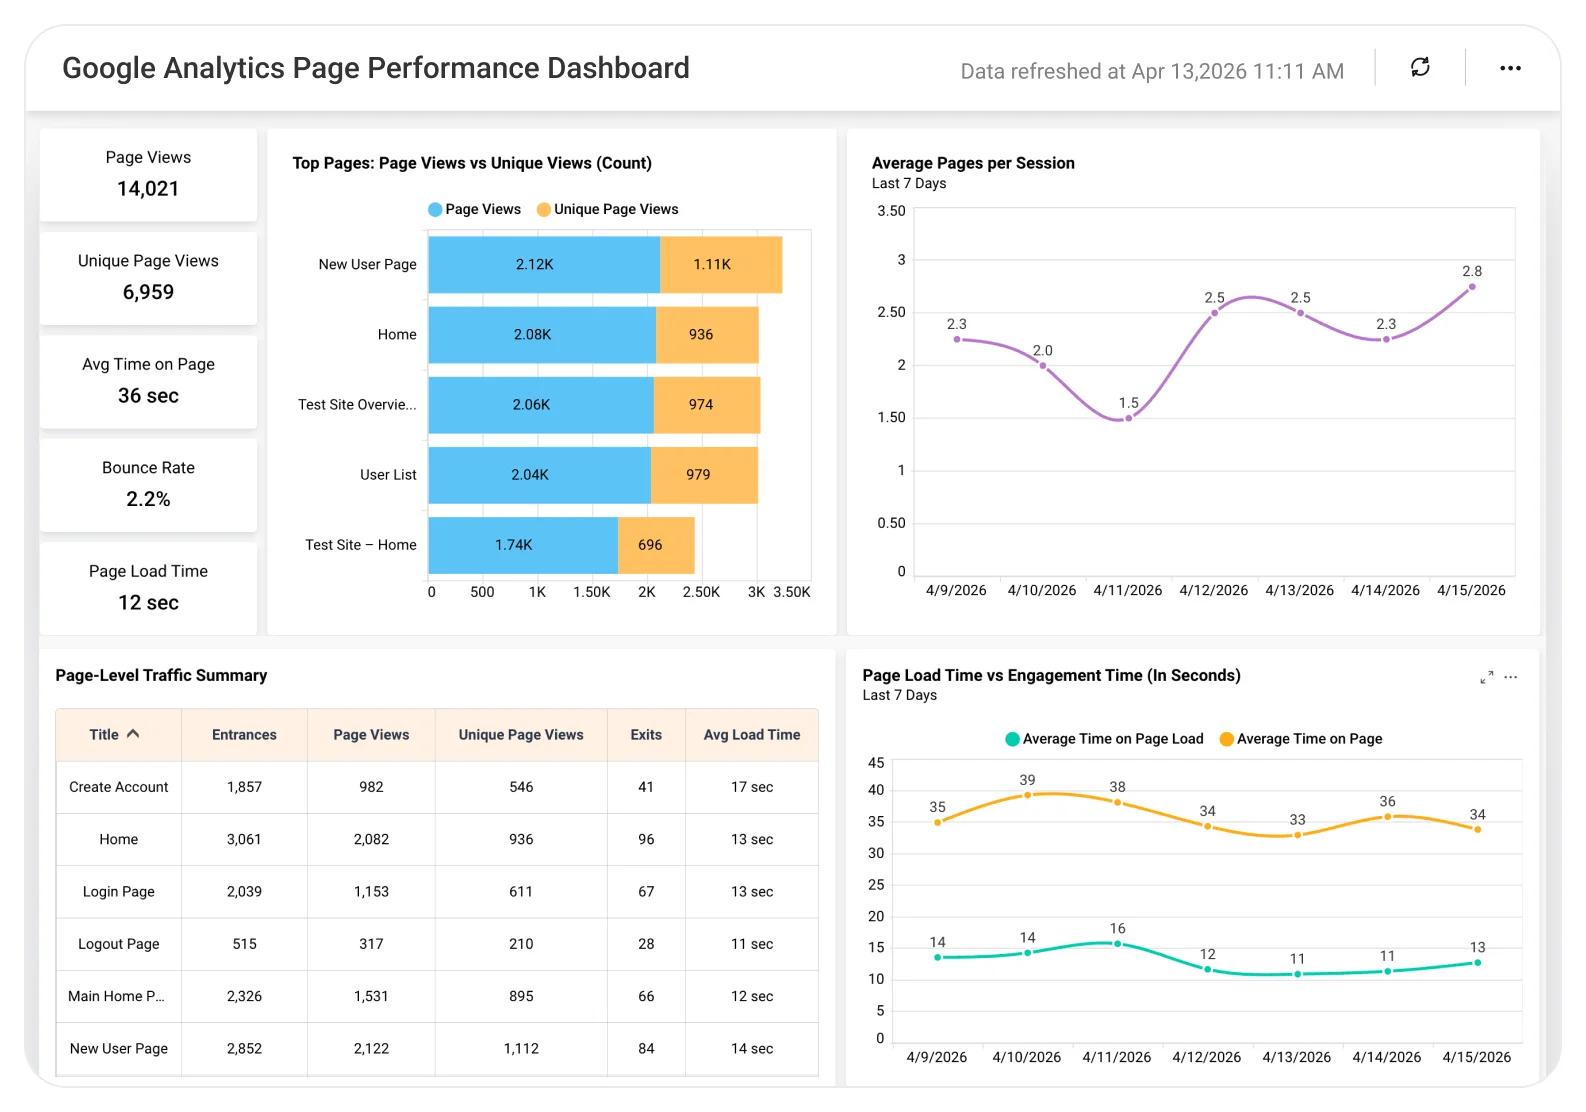
The Google Analytics Page Performance Dashboard helps teams analyze page views, bounce rates, time on page, and user behavior, enabling better content optimization, improved navigation, and higher conversion outcomes.
TL;DR
-
Total page views and unique page views.
-
Average time spent on each page.
-
Pages viewed per session.
-
Average page load time.
-
Daily page view trends.
-
Entrances, exits, and page-level engagement metrics.
What Is a Google Analytics Page Performance Dashboard?
A Google Analytics Page Performance Dashboard is a visual analytics tool that tracks page views, engagement metrics, and page load times using Google Analytics data.
In Bold BI, this data is visualized in a single dashboard that shows which pages perform best, where users drop off, and how load speed affects engagement.
Why Google Analytics Page Performance Dashboard Matters
Website performance data is vast, dynamic, and critical for digital success.
Without a centralized analytics view:
-
Page engagement is hard to compare across different sections.
-
Bounce rates and conversion trends are difficult to analyze.
-
Content optimization lacks data-backed prioritization.
-
Forecasting future traffic and user behavior becomes guesswork.
Bold BI organizes complex web performance data into a single dashboard, making it easier for marketing and analytics teams to monitor traffic, engagement, and conversion trends across all pages.
What You’ll Track
Using Bold BI dashboards, you will track important project overview KPIs such as:
-
Page view metrics: Monitor total and unique page views to understand which pages attract the most traffic.
-
User engagement metrics: Track average time on page, pages per session, entrances, and exits to identify high-engagement and high-drop-off pages.
-
Page-level behavior insights: Analyze page-wise engagement patterns to see where users continue browsing or leave.
-
Page load & technical performance: Measure average page load time, redirection time, and domain lookup time to identify speed issues affecting user experience.
-
Trend analysis over time: View daily page-view trends and load-time changes to spot performance improvements or declines.
All dashboards are fully customizable so you can add KPIs, apply filters, and blend engagement and technical metrics into one interactive view.
How It Works
-
Connect Google Analytics and related Web data or exported Excel/SQL databases.
-
Apply the Google Analytics Page Performance Dashboard sample.
-
Blend engagement and technical metrics into one view.
-
Act on insights to optimize content and improve site performance.
-
Share dashboards securely with marketing, growth, and UX teams.
Why Bold BI Is the Right Fit for Google Analytics Page Performance Analytics
Bold BI is designed to analyze large, multi-dimensional datasets efficiently, including Google Analytics data.
With Bold BI, you can:
-
Analyze page performance across multiple sites from a single dashboard.
-
Break down metrics by traffic source, device type, and user demographics.
-
Track engagement KPIs like bounce rate, session duration, and conversions.
-
Forecast future traffic and engagement based on historical trends.
-
Deploy dashboards in cloud or self-hosted environments flexibly and securely.
Compare Options (at a glance)
| Feature | Bold BI | Google Analytics (GA4) Reports | Spreadsheets / Manual Reporting |
|---|---|---|---|
| Page-level trends (views, users, entrances over time) | Yes | Yes | Manual |
| Engagement by page (avg engagement time, scroll/events, exits) | Yes | Partial (often needs exploration) | Manual |
| Landing page performance & segmentation | Yes | Yes | Manual |
| ** Conversion contribution by page (paths, assisted conversions) | Yes | Limited | Manual |
| Custom KPIs & dashboards | Fully customizable | Fully customizable | Limited/custom |
Frequently Asked Questions
More Articles About Google Analytics Page Performance
-
Maximize Page Performance on Your Website Using Embedded Analytic
 This blog explains why page performance matters, the KPIs involved (page views, pages/session, load time), and how Bold BI’s Page Performance dashboard helps improve engagement and conversions.