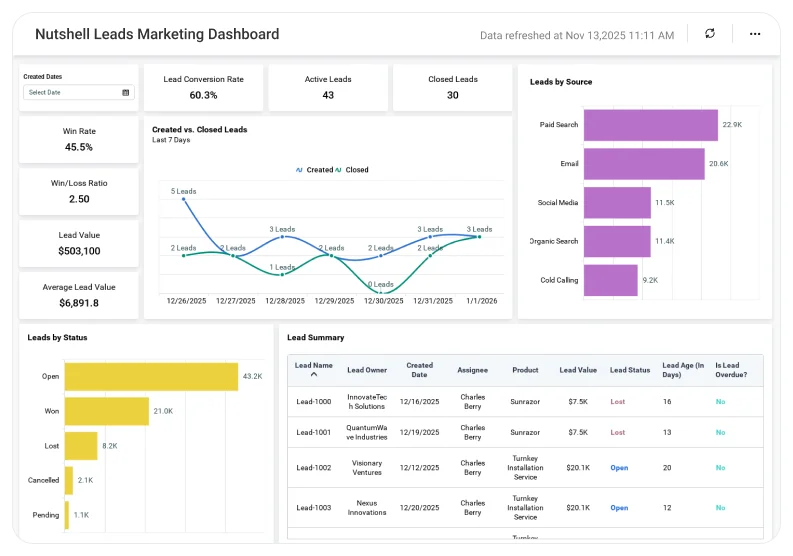
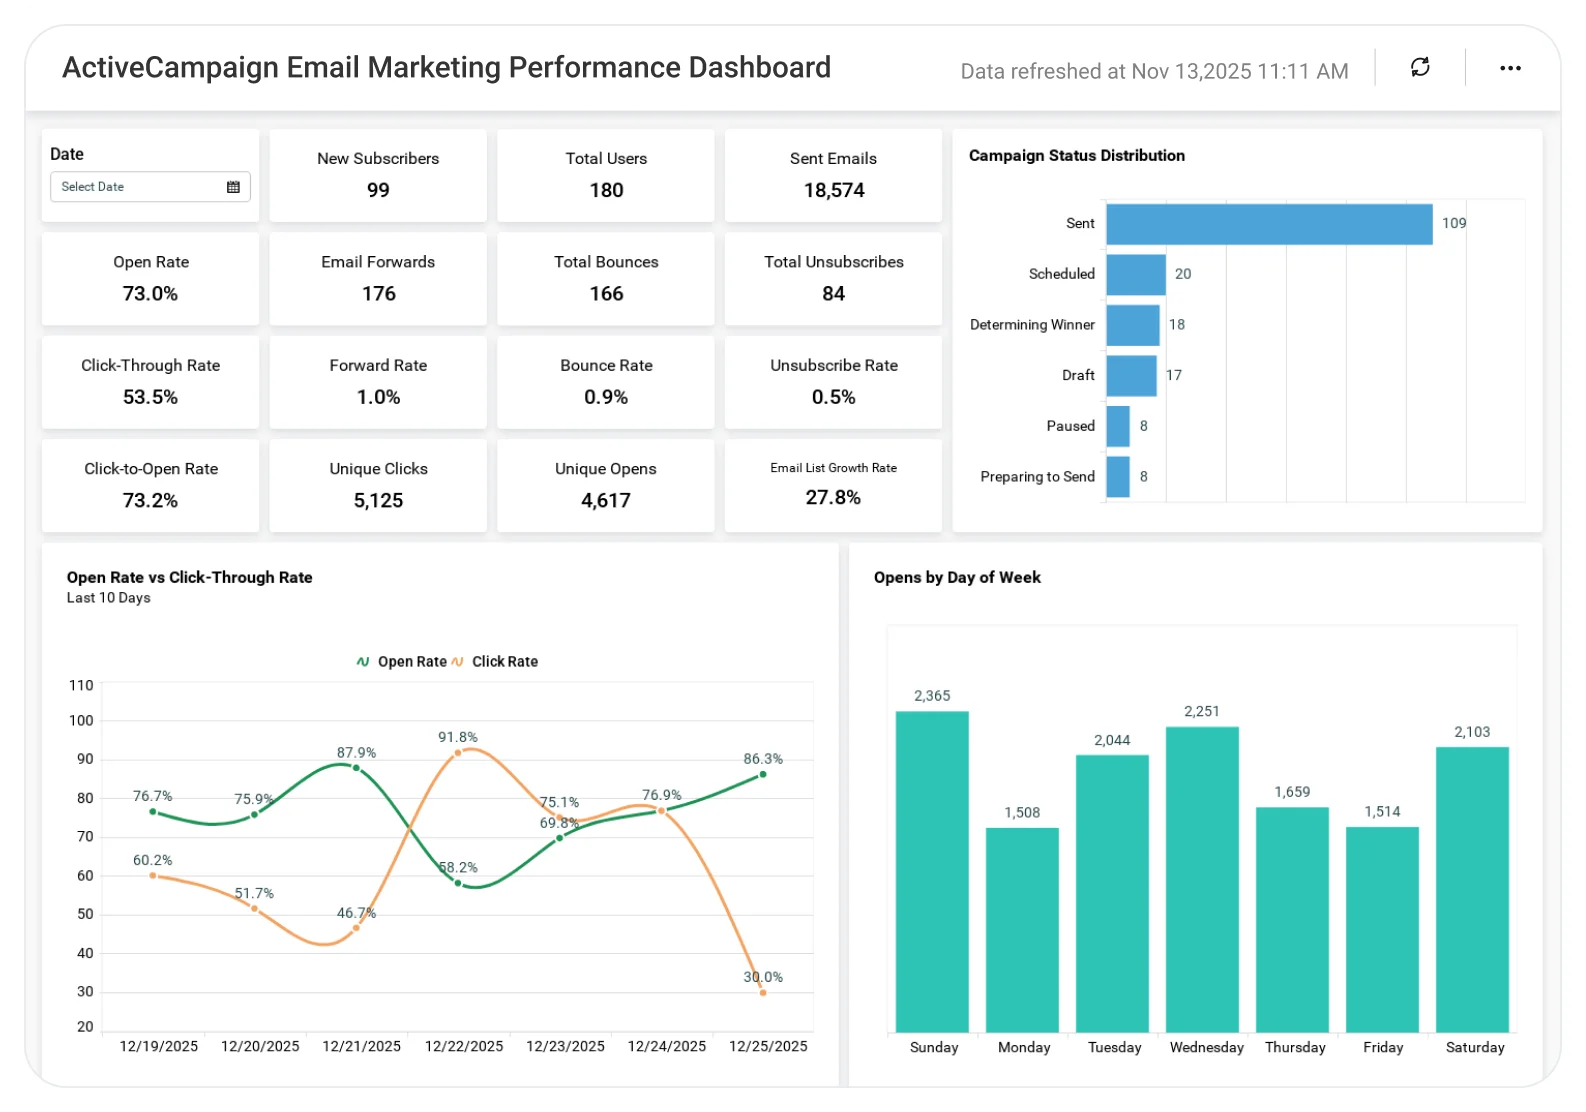
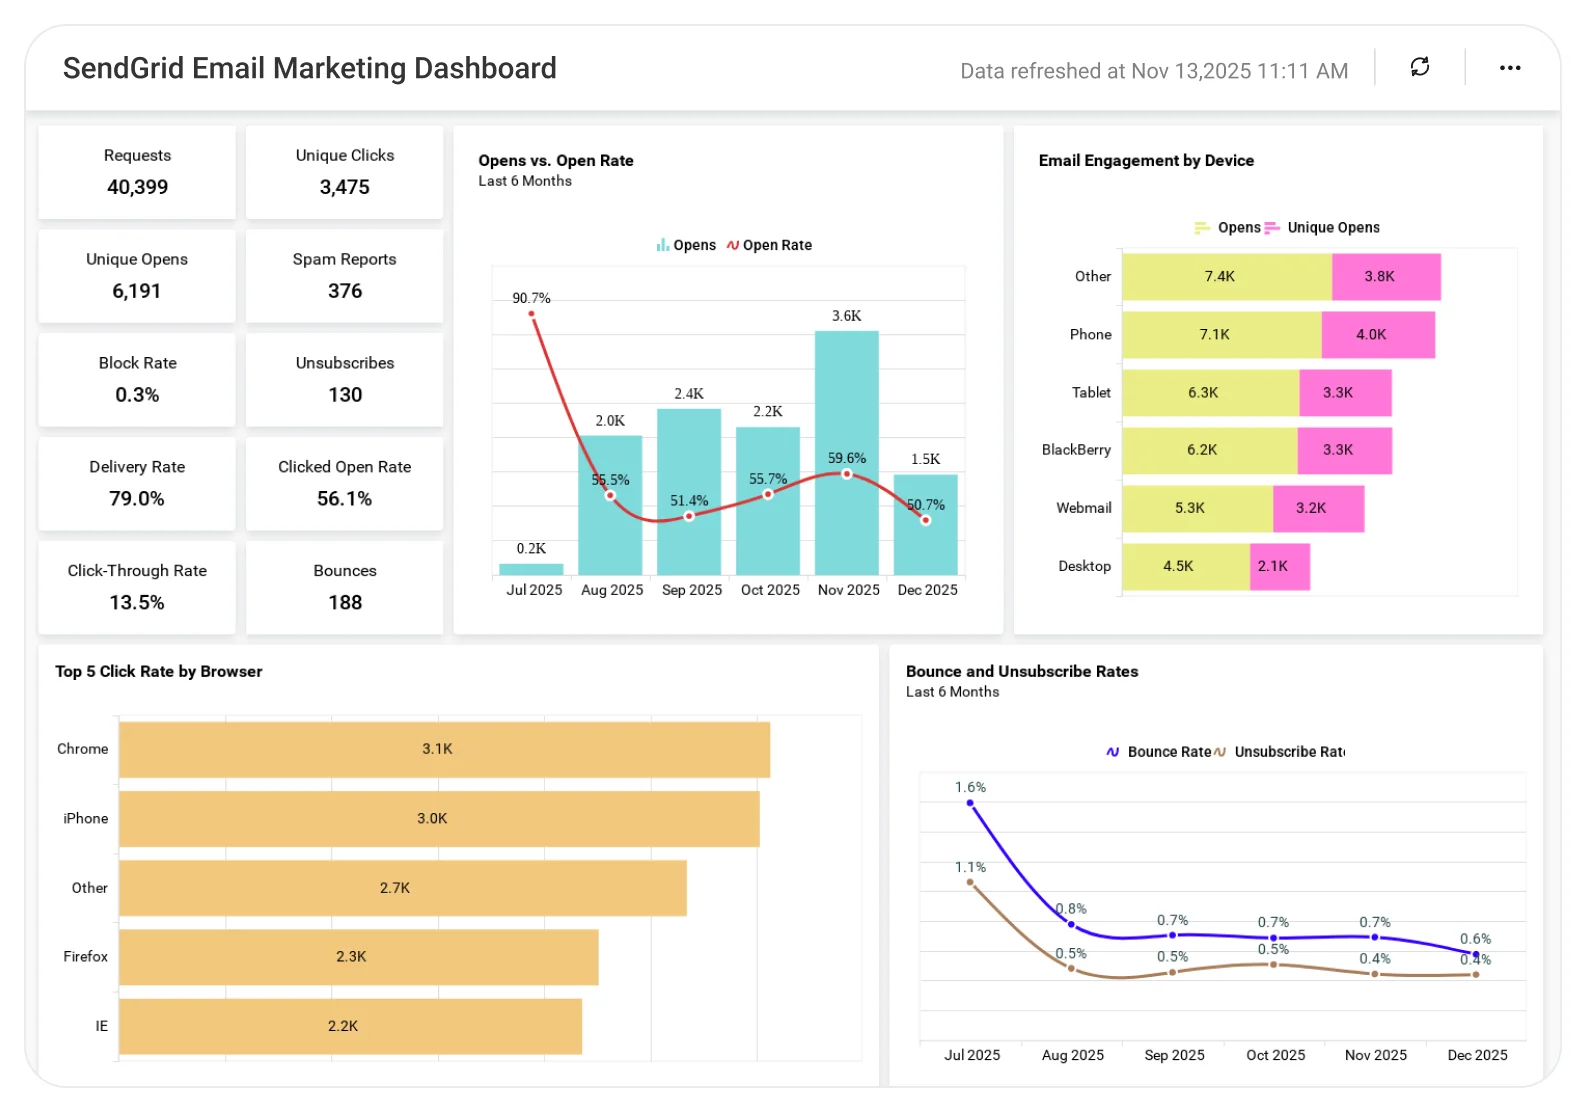
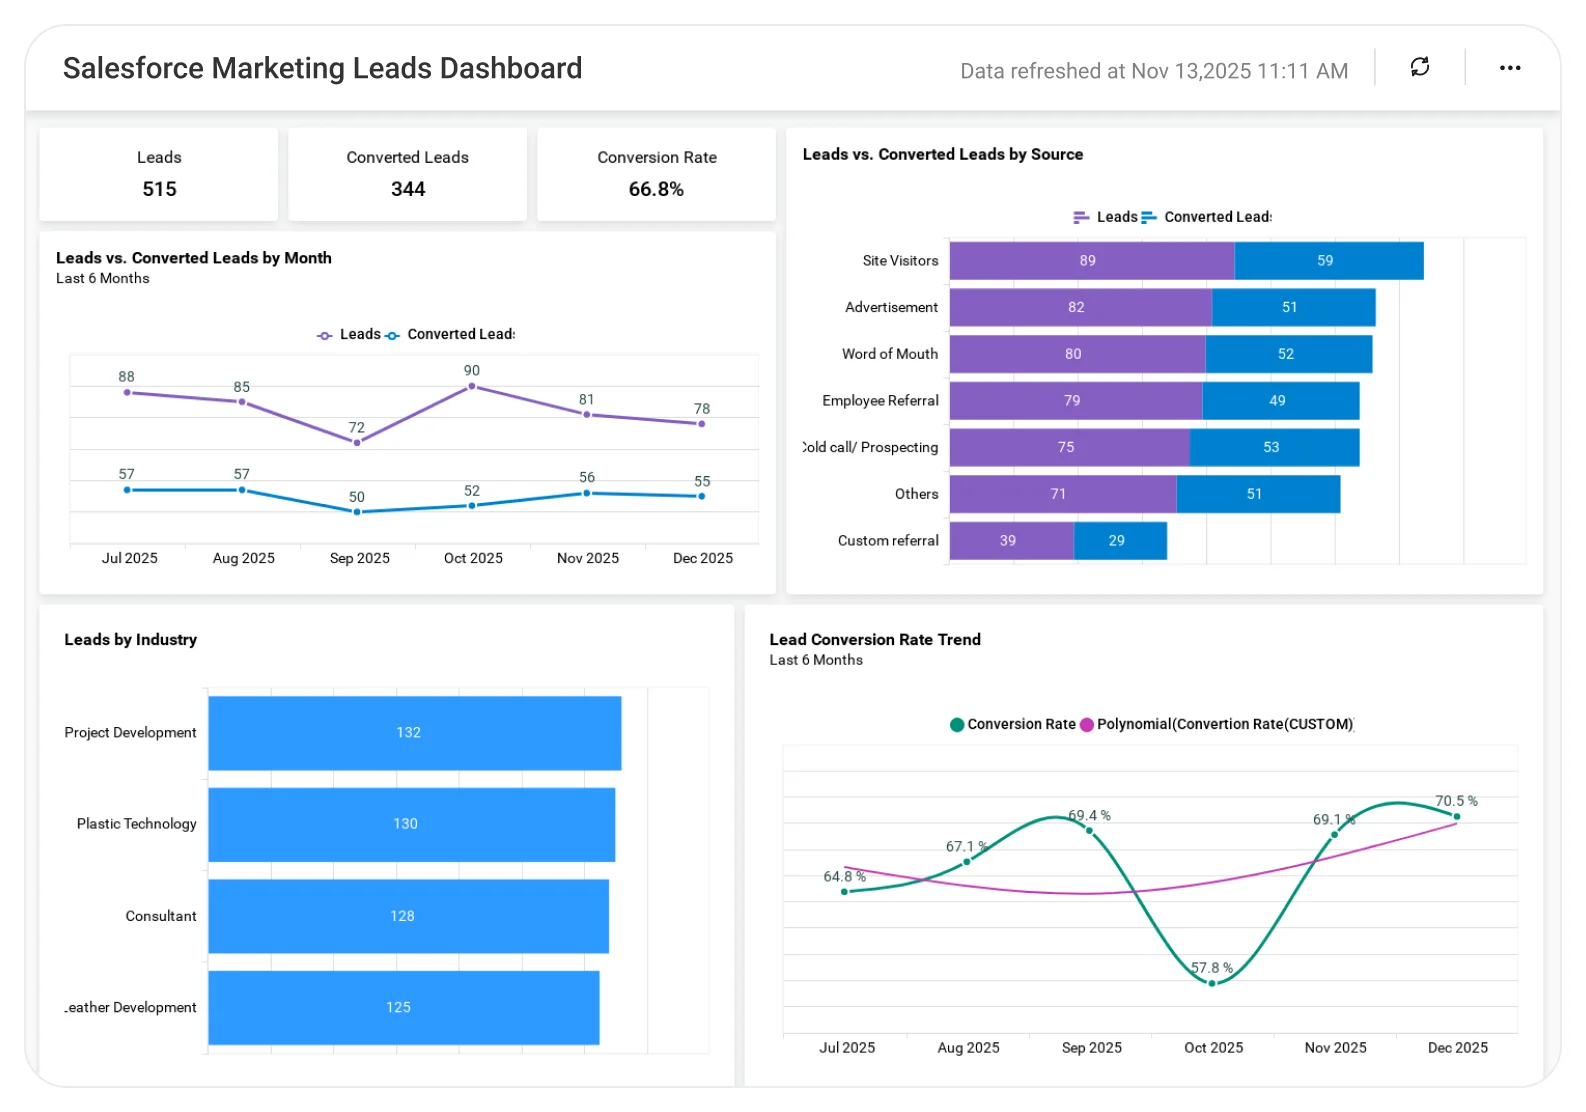
Ads Campaign Performance Dashboard
Understand ad campaign performance to improve ROI and marketing efficiency.
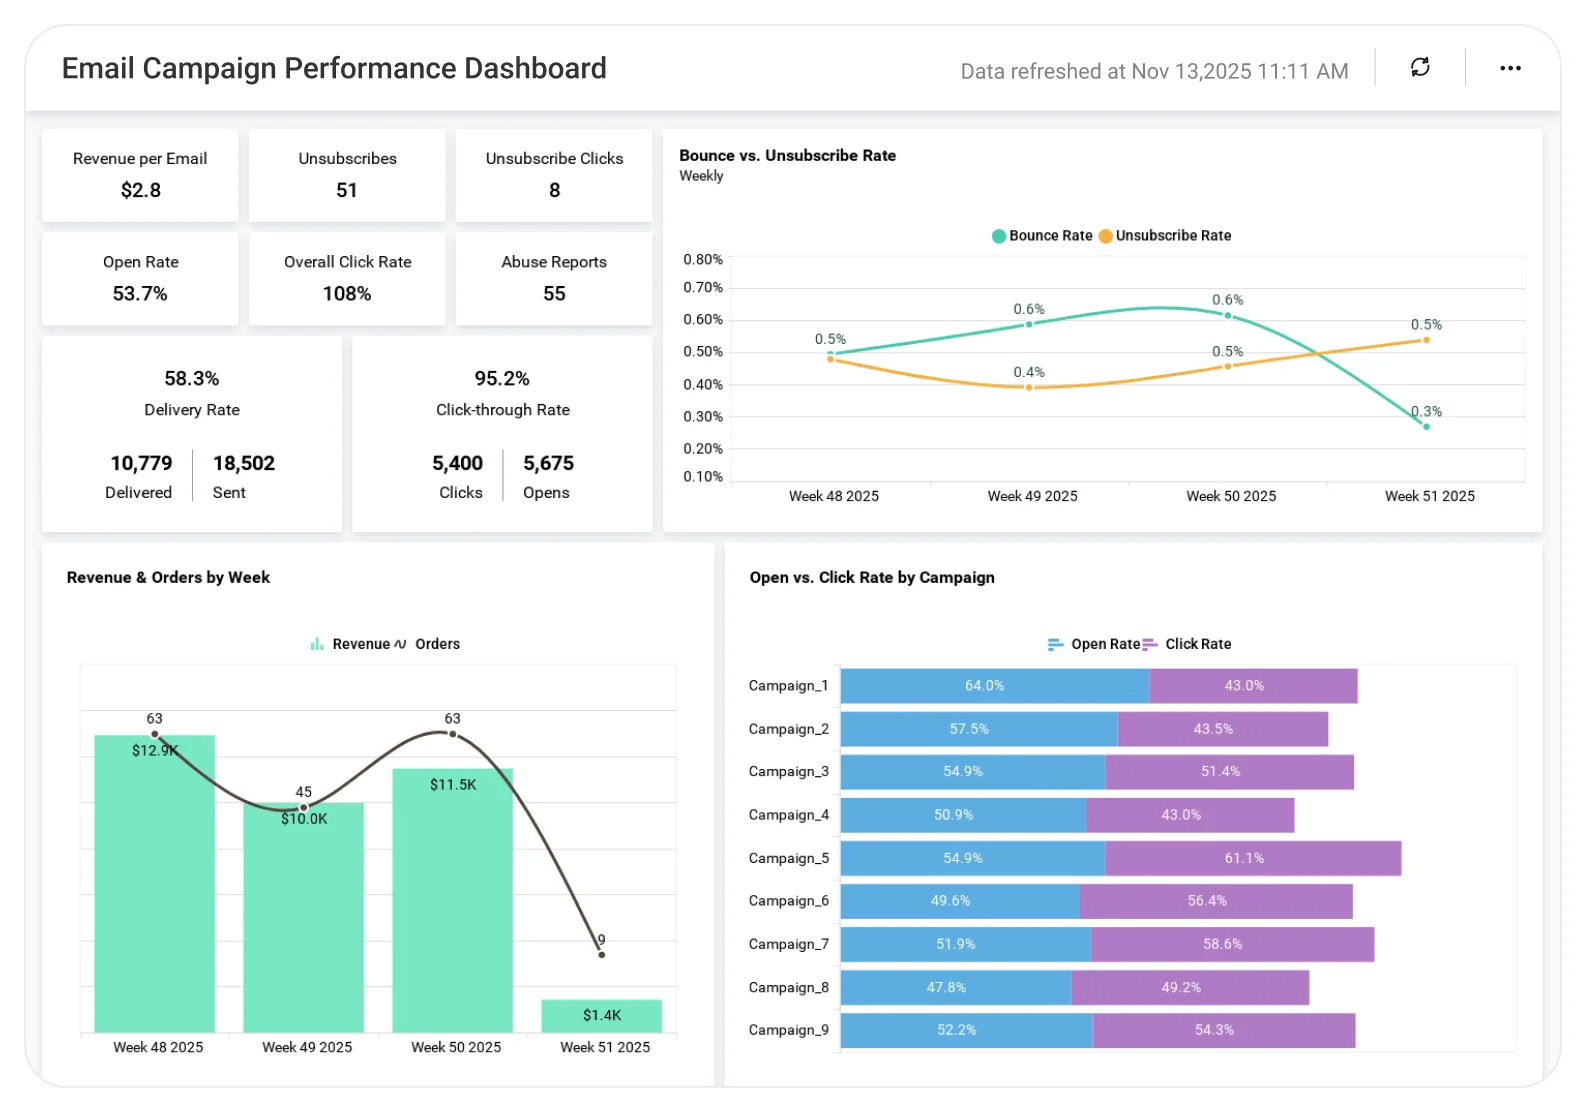
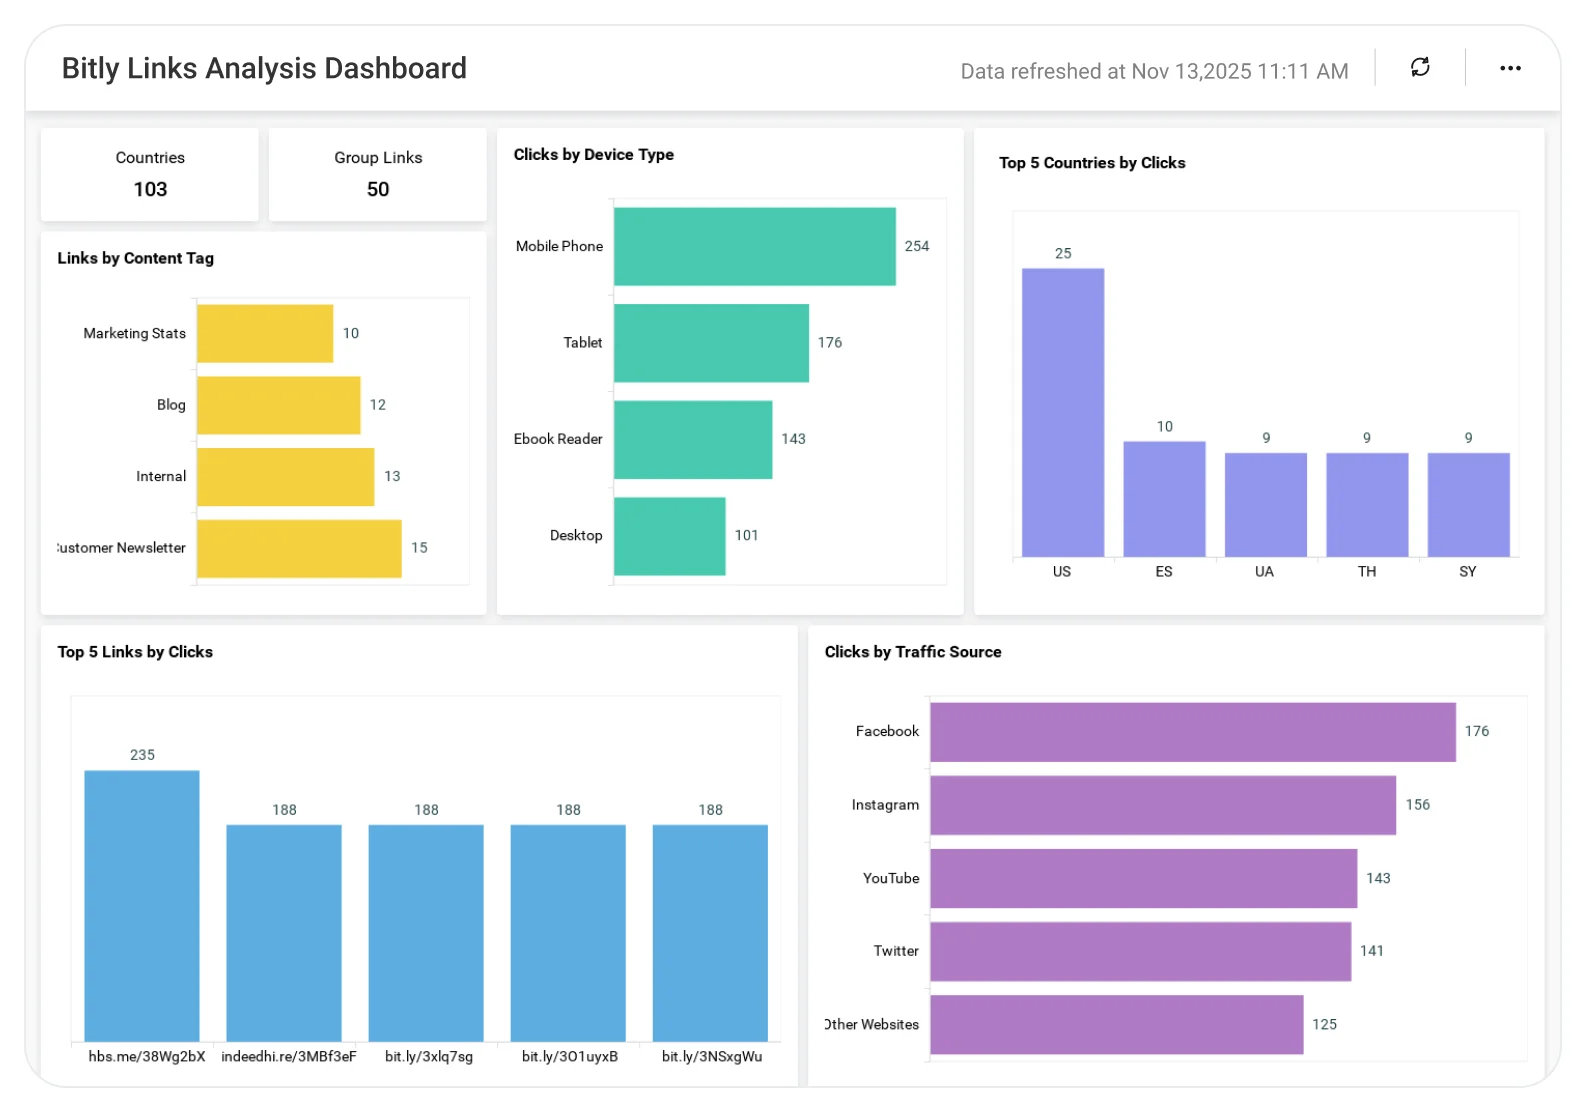
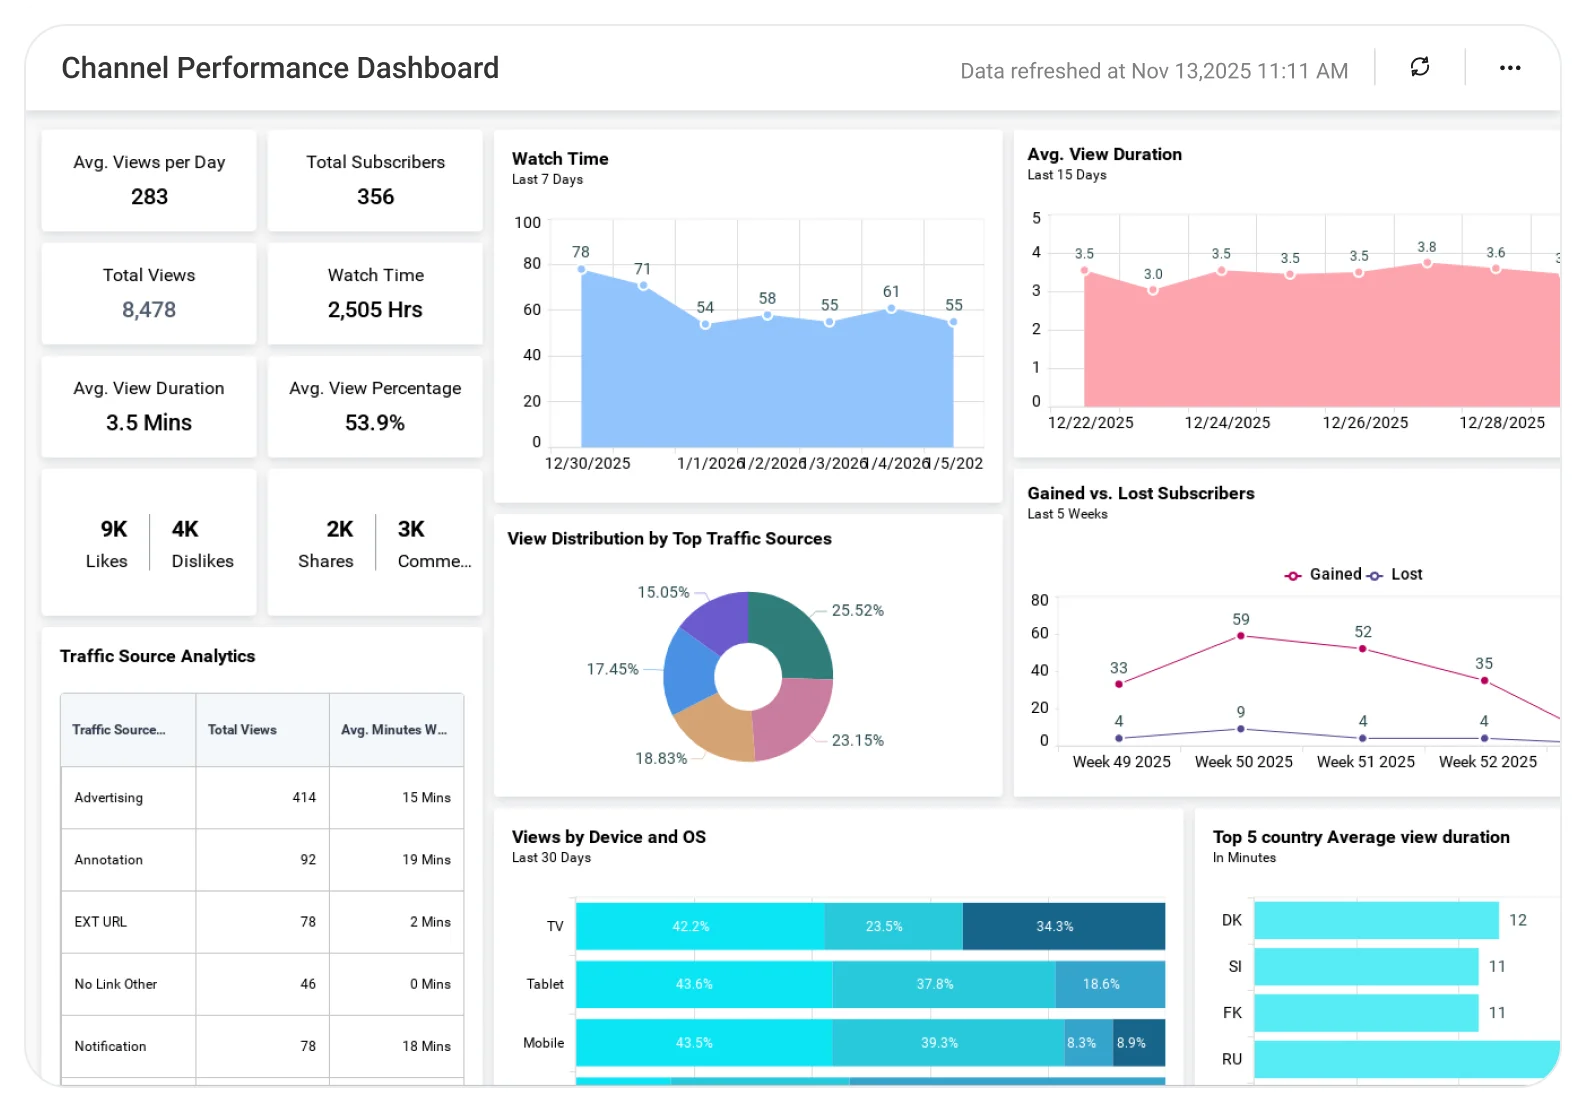
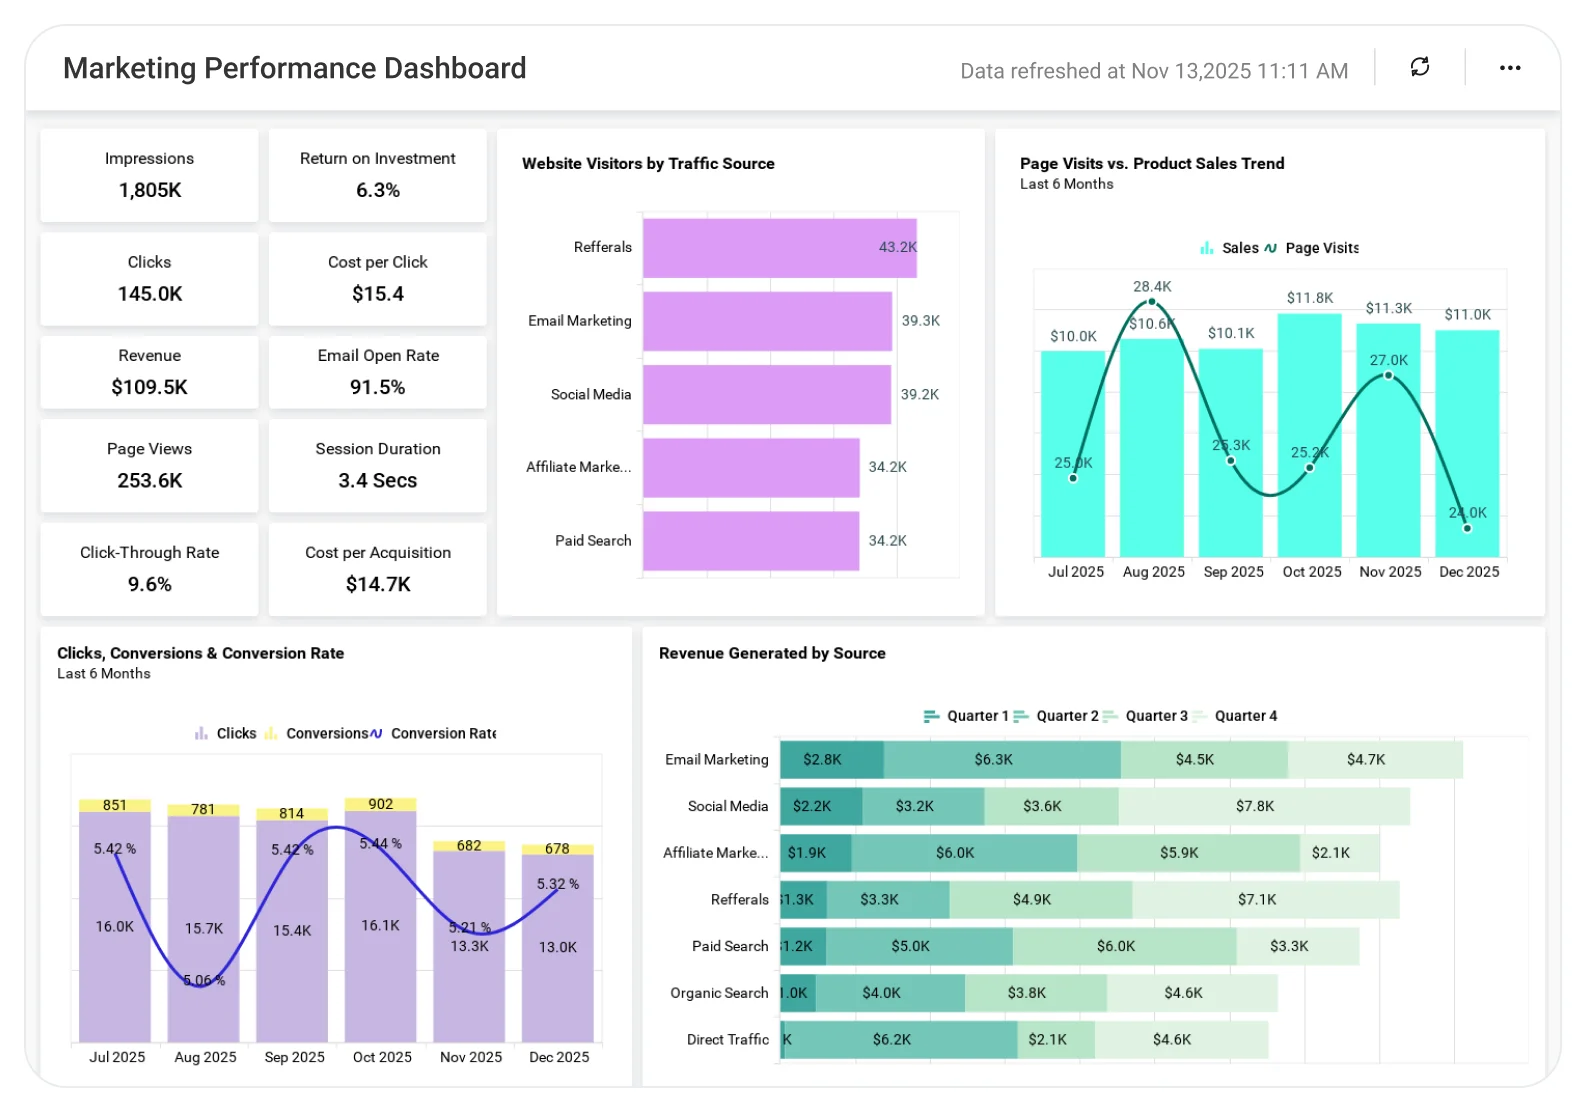
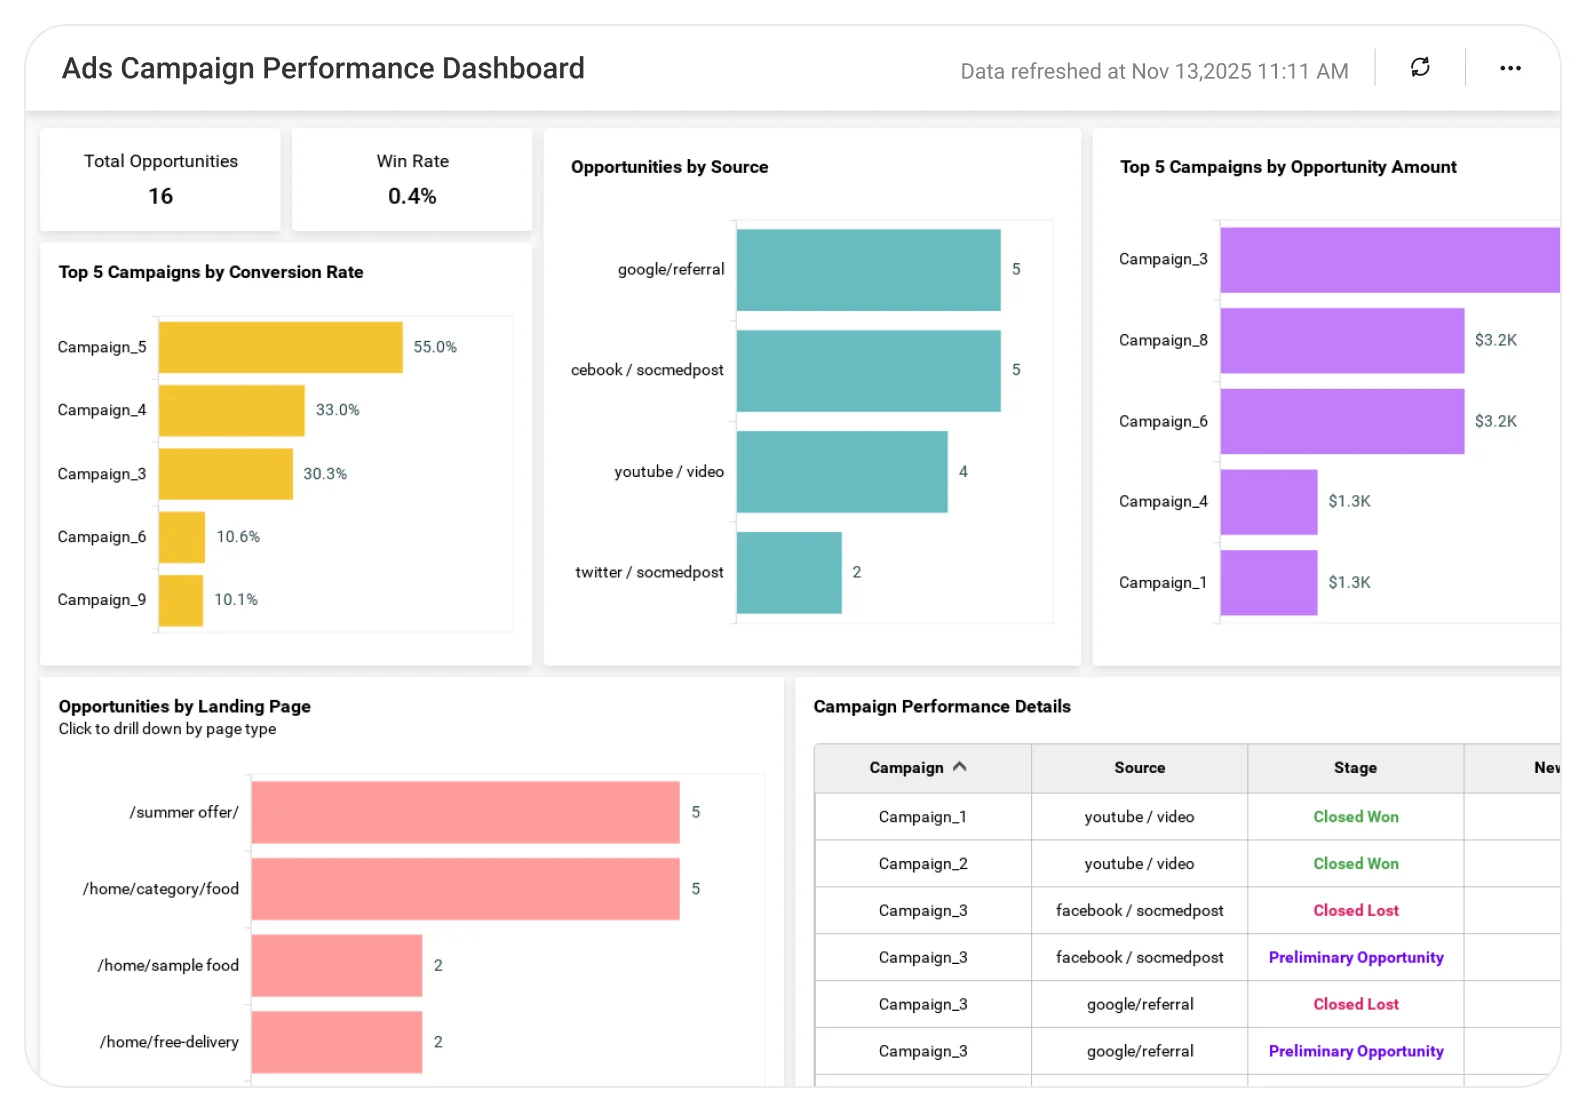
The Ads Campaign Performance Dashboard helps teams analyze ad spend, impressions, clicks, conversions, and campaign results across channels, enabling better budget allocation, optimization, and data-driven marketing decisions.
TL;DR
-
A full conversion funnel from users to closed sales.
-
Opportunities generated by campaign, source, and landing page.
-
Campaign-level conversion rates.
-
Performance comparisons across digital channels.
-
Drilldowns by campaign and traffic source.
What Is an Ads Campaign Performance Dashboard?
An Ads Campaign Performance Dashboard is a visual analytics tool that tracks how users move from ads to leads, opportunities, and closed sales.
In Bold BI, this means interactive funnels, KPIs , charts and tables that connect campaign activity with real business outcomes.
Why Ads Campaign Performance Dashboard Matters
Ad campaigns generate data across multiple platforms, but insights often stay fragmented.
Without a unified dashboard:
-
Conversion leaks go unnoticed.
-
High-traffic but low-converting campaigns waste budget.
-
Landing page performance is hard to compare.
-
Attribution decisions rely on incomplete or inconsistent data.
Bold BI consolidates campaign data into one clear performance view, helping teams optimize spending, improve conversions, and prove marketing ROI.
What You’ll Track
-
Conversion funnel performance: Track users, leads, opportunities, and closed sales with clear stage-to-stage conversion rates.
-
Campaign & source effectiveness: Identify which campaigns and traffic sources (Google, YouTube, Facebook, X, etc.) generate the most opportunities.
-
Landing page performance: Compare landing pages based on opportunity creation and conversion efficiency.
-
Opportunity stages & totals: Analyze how opportunities progress across stages by campaign and source.
All dashboards are fully customizable so you can add KPIs or metrics as needed.
How It Works
-
Connect to ad platforms, CRM systems, or marketing databases.
-
Apply the Ads Campaign Performance Dashboard sample.
-
Analyze the conversion funnel and opportunity stages.
-
Filter data by campaign and traffic source.
-
Drill down into specific campaigns, sources, or time periods.
Why Bold BI Is the Right Fit for Ads Campaign Analytics
-
One dashboard from ad click to opportunity.
-
Funnel visualization is tied directly to opportunities and closed sales, not just clicks or impressions.
-
Enterprise-grade security with Single Sign On, Role Based Access Control and Row Level Security.
-
Embeddable dashboards for marketing and CRM platforms.
-
Flexible deployment : cloud or self-hosted.
Compare Options (at a glance)
| Feature | Bold BI | Ad Platform Reports | Spreadsheets |
| Conversion funnel | Yes | Partial | Manual |
| Multi-channel attribution | Yes | Limited | Manual |
| Landing page analysis | Yes | Limited | Manual |
| Opportunity-stage tracking | Yes | No | Manual |
| Deployment | Cloud / self-hosted | SaaS only | Local |
Frequently Asked Questions
More Articles About Ads Campaign Performance Dashboard
-
Monitoring Ad Performance in a Google Ads Dashboard
 A detailed Bold BI blog post explaining how to define key metrics (impressions, CTR, CPC, cost per conversion, RPC) and build a comprehensive Google Ads dashboard using KPI cards, line charts, and combo charts.