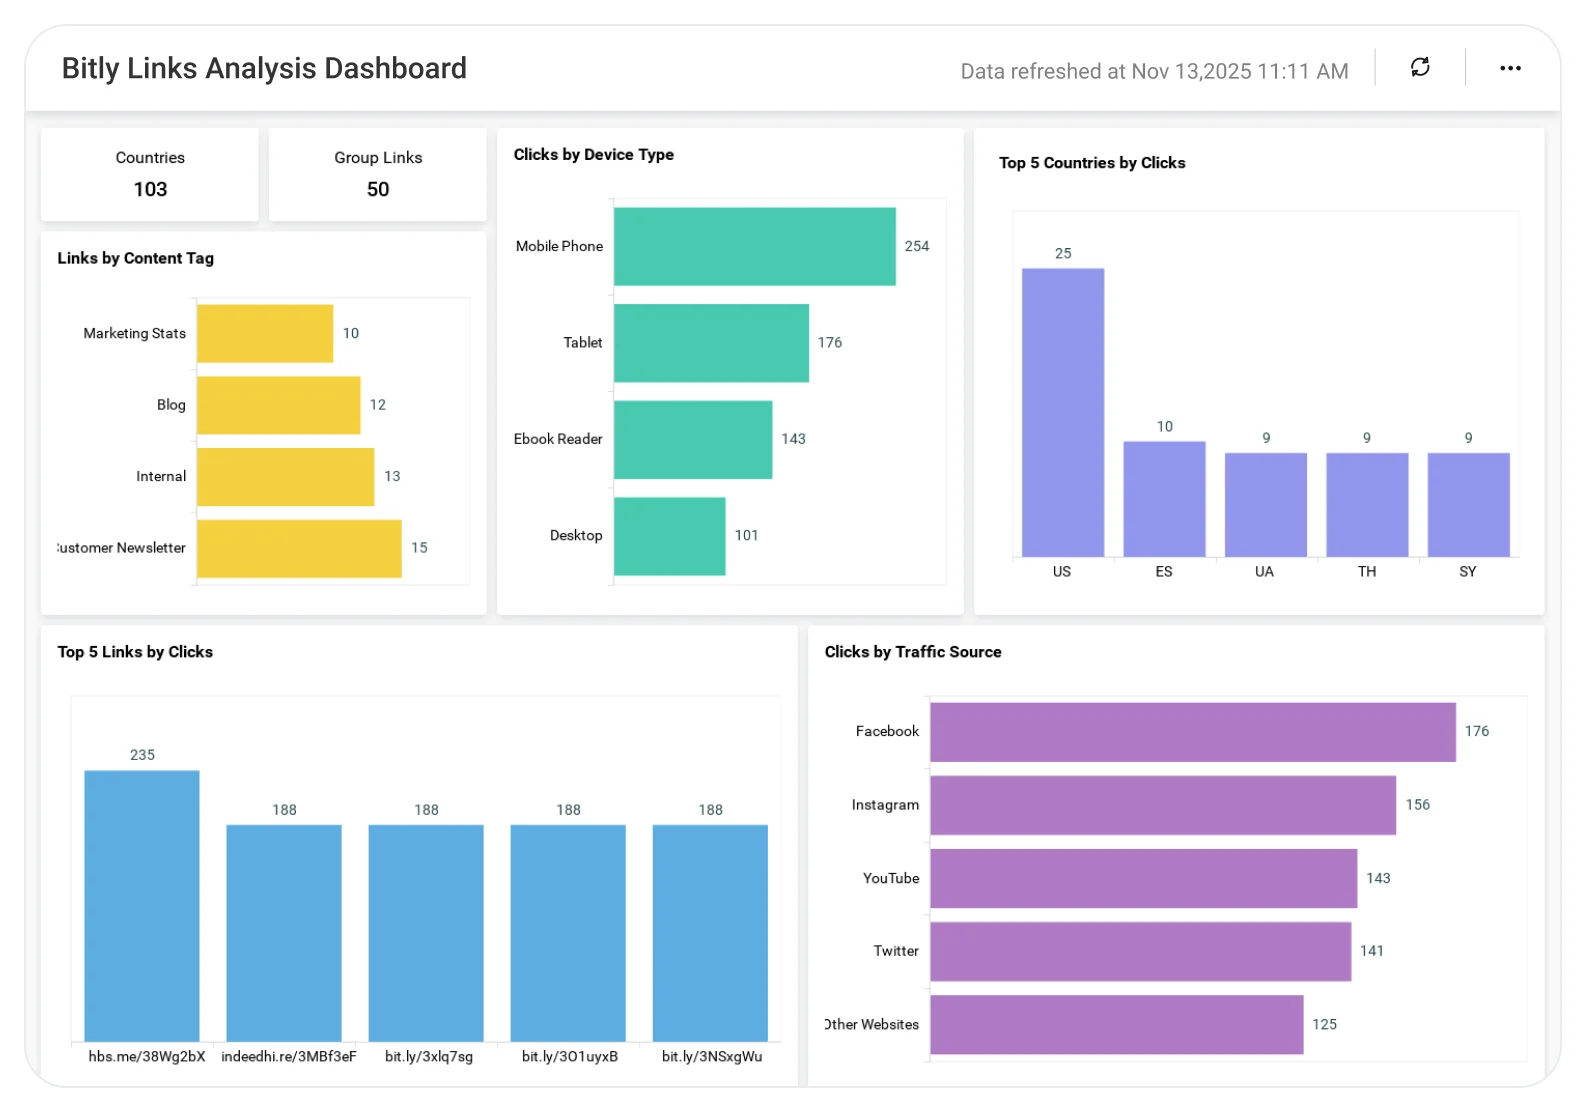
Bitly Links Analysis Dashboard
Understand link performance to improve click-through rates and campaign effectiveness. The Bitly Links Analysis Dashboard helps marketing teams analyze link clicks, traffic sources, and engagement trends, enabling better campaign optimization, improved content performance, and data-driven marketing decisions.
TL;DR
-
How many Bitly links you’re actively managing across campaigns and channels.
-
Which links generate the most clicks, so you can double down on what works.
-
Where your clicks come from for example email, social, ads, or referrals.
-
Which campaigns, tags, or sources drive engagement, not just traffic.
-
Where your audience is clicking globally, by country and region.
-
How link creation and clicks trend over time, revealing campaign momentum.
What Is a Bitly Links Analysis Dashboard?
A Bitly Links Analysis Dashboard is a visual analytics tool that tracks link usage, clicks, sources, and geographic engagement using Bitly data.
In Bold BI, it becomes an interactive dashboard with filters, drilldowns, and real-time updates, helping teams measure link performance and improve campaign outcomes.
Why Bitly Links Analysis Dashboard Matters
Shortened links are everywhere, be it email campaigns, social media, ads, and partner promotions. But without a consolidated view, it’s difficult to identify what drives engagement.
With the Bitly Links Analysis Dashboard, leaders can quickly answer:
-
How many links are we currently managing?
-
Where in the world are users clicking our links?
-
Which sources generate the most clicks?
-
How many clicks did we receive in the past month?
-
Which links and tags perform best?
What You’ll Track
Using Bold BI dashboards, you will track important project overview KPIs such as:
-
Link overview metrics: Track total links, clicks, and tags across all Bitly URLs.
-
Click source performance: Identify which channels generate the highest click volume.
-
Time-based activity trends: Monitor links created and clicks over recent days or months.
-
Geographic engagement: Analyze click activity by country to understand global reach.
All dashboards are fully customizable so you can add KPIs or metrics as needed.
How It Works
-
Apply the Bitly Links Analysis Dashboard sample.
-
Blend link metrics with campaign or channel data if needed.
-
Share dashboards securely with marketing teams and leadership.
-
Act on insights to improve link strategy and campaign performance.
Why Bold BI Is the Right Fit for Bitly Links Analytics
Bold BI gives you portfolio-wide analytics, governed sharing, and deep drilldown capabilities Bitly's built-in reporting doesn’t offer.
-
Unified view of all Bitly link metrics.
-
Interactive charts with filters and drilldowns.
-
Global visibility with map-based analytics.
-
Enterprise-grade security with Row-Level Security, SSO, Role-Based Access Control and audit logs.
-
Embeddable dashboards for internal marketing tools.
-
Flexible deployment: cloud or self-hosted.
Compare Options (at a glance)
| Feature | Bold BI | Bitly Built-in Analytics | Spreadsheets / Manual Reporting |
|---|---|---|---|
| Click performance overview (total clicks, unique clicks, trends) | Yes | Yes (basic) | Manual |
| Top links & content performance | Yes | Limited | Manual |
| Audience insights (geo, device, referrer) | Yes | Yes (varies by plan) | Manual |
| Campaign/UTM tracking & rollups | Yes | Limited | Manual |
| Custom KPIs & dashboards | Fully customizable | Fixed/limited | Manual |
Frequently Asked Questions
More Articles About Bitly Links Analysis
-
Unleash the Power of Bitly Link Tracking and Visualization
 This blog explains how Bitly link tracking can be visualized in dashboards to uncover engagement patterns and improve marketing decisions.
-
10 Best Marketing Dashboards to Grow Your Business
This blog showcases top marketing dashboard examples and explains how visual analytics help teams monitor campaign performance, traffic sources, and user engagement.