YouTube Channel Performance Dashboard
Improve channel growth by understanding video performance and audience engagement trends.
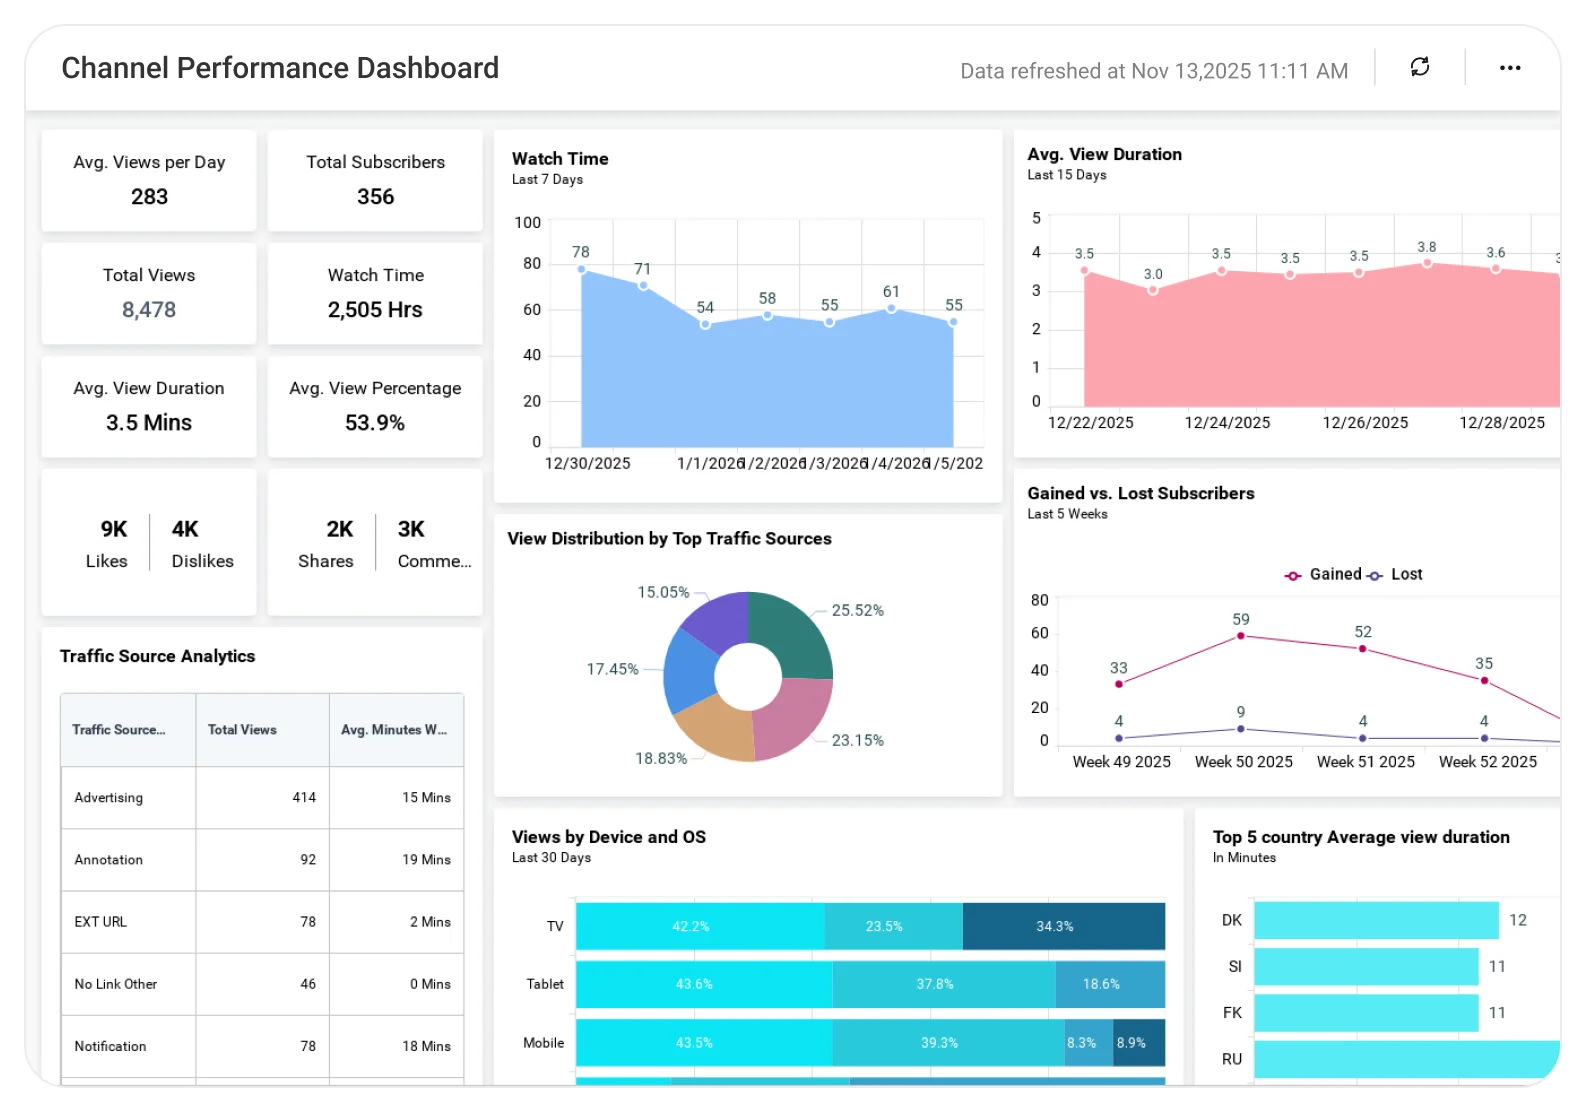
The YouTube Channel Performance Dashboard helps marketing teams analyze views, watch time, subscriber growth, and engagement metrics, enabling better content strategy, higher reach, and improved audience retention.
TL;DR
-
Audience growth tracking: Subscribers, unsubscribes, and engagement trends over time.
-
Behavioral insights: Comments, shares, average view duration, viewer retention.
-
Content performance: View trends by date, geography, and device.
-
Executive view: Channel health, traffic patterns, and marketing impact.
-
Data-driven insights: Faster and smarter marketing decisions can be made.
What Is a YouTube Channel Performance Dashboard?
A YouTube Channel Performance Dashboard gives marketing teams a live view of channel growth, engagement, and audience reach. It brings together key metrics like subscribers, unsubscribes, views, comments, shares, and watch time in one place.
With Bold BI, teams use interactive visuals, trend lines, geographic maps, and drill-downs to understand how content and campaigns are performing over time.
Why YouTube Channel Performance Dashboard Matters
YouTube performance changes daily, and relying on individual reports or snapshots makes it hard to understand what’s actually driving growth. Without a unified view, teams can miss engagement drops, churn signals, or regional opportunities.
A YouTube Channel Performance Dashboard helps teams track growth versus churn, understand viewer behavior, evaluate campaign impact, and adjust content strategy quickly so marketing efforts stay aligned with audience interests and business goals.
What You’ll Track
Using Bold BI dashboards for YouTube channel performance, you will track critical KPIs such as:
-
Subscriber overview: Track total subscribers, unsubscribes, and growth trends over time.
-
Engagement insights: View comments, likes, shares, and interaction patterns that reveal which videos or campaigns drive audience response.
-
View behaviour: Analyze views by date, average view duration, and retention trends.
-
Geographic reach: Understand views by country, regional engagement patterns, and audience clusters that help shape localized marketing strategies.
-
Performance trends: Visualize daily view activity, subscriber movement, engagement spikes, and correlations between posting frequency and viewer actions.
All dashboards are fully customizable so you can add KPIs, change thresholds, or blend YouTube data with campaign and website analytics to create a complete marketing intelligence system.
How It Works
Bold BI connects directly to your YouTube channel data and transforms it into interactive, real-time dashboards.
-
Connect your data: Pull subscriber, view, engagement, and geographic data directly from YouTube.
-
Auto-refresh dashboards: Metrics stay up to date without manual exports or spreadsheets.
-
Explore with filters: Drill down by date, campaign, video, or region to analyze performance.
-
Share insights securely: Control access using role-based permissions and share dashboards with marketing and leadership teams.
Why Bold BI Is the Right Fit for YouTube Channel Performance Analytics
-
Unified channel performance view: Manage subscriber growth, engagement, views, and geographic reach in one dashboard.
-
Time & campaign-level drilldowns: Drill from channel-level metrics down to specific dates, videos, or campaigns.
-
Self-service analytics: Enable marketing managers, social media specialists, and leadership to explore insights independently.
-
Secure & governed sharing: Share dashboards safely using Row Level Security(RLS), Single Sign On(SSO), and Role Based Access Control(RBAC).
Compare Options (at a glance)
| Feature | Bold BI | YouTube Studio Analytics | Spreadsheets / Manual Reporting |
|---|---|---|---|
| Views, watch time, and subscriber growth trends | Yes | Yes | Manual |
| Content performance (top videos, retention, engagement) | Yes | Yes | Manual |
| Traffic sources & discovery (search, suggested, external) | Yes | Yes | Manual |
| Audience insights (demographics, geo, device, returning viewers) | Yes | Yes | Manual |
| Custom KPIs & dashboards | Fully customizable | Limited to Studio views | Manual |
Frequently Asked Questions
More Articles About YouTube Channel Performance
-
Driving Growth: How BI Tools Transform YouTube Channel Performance
 This blog walks through how these setups break down engagement and spot key trends. In the end, they make social media efforts to perform a lot stronger.
-
10 Best Marketing Dashboards to Grow Your Business
This blog points out the top options that let you watch campaigns closely. They also help push your reach further while sharpening up that return on investment.
-
3 Must-Have Social Media Analytics Dashboard Examples
This blog walks through how these setups break down engagement and spot key trends. In the end, they make social media efforts perform a lot stronger.