Department : Marketing

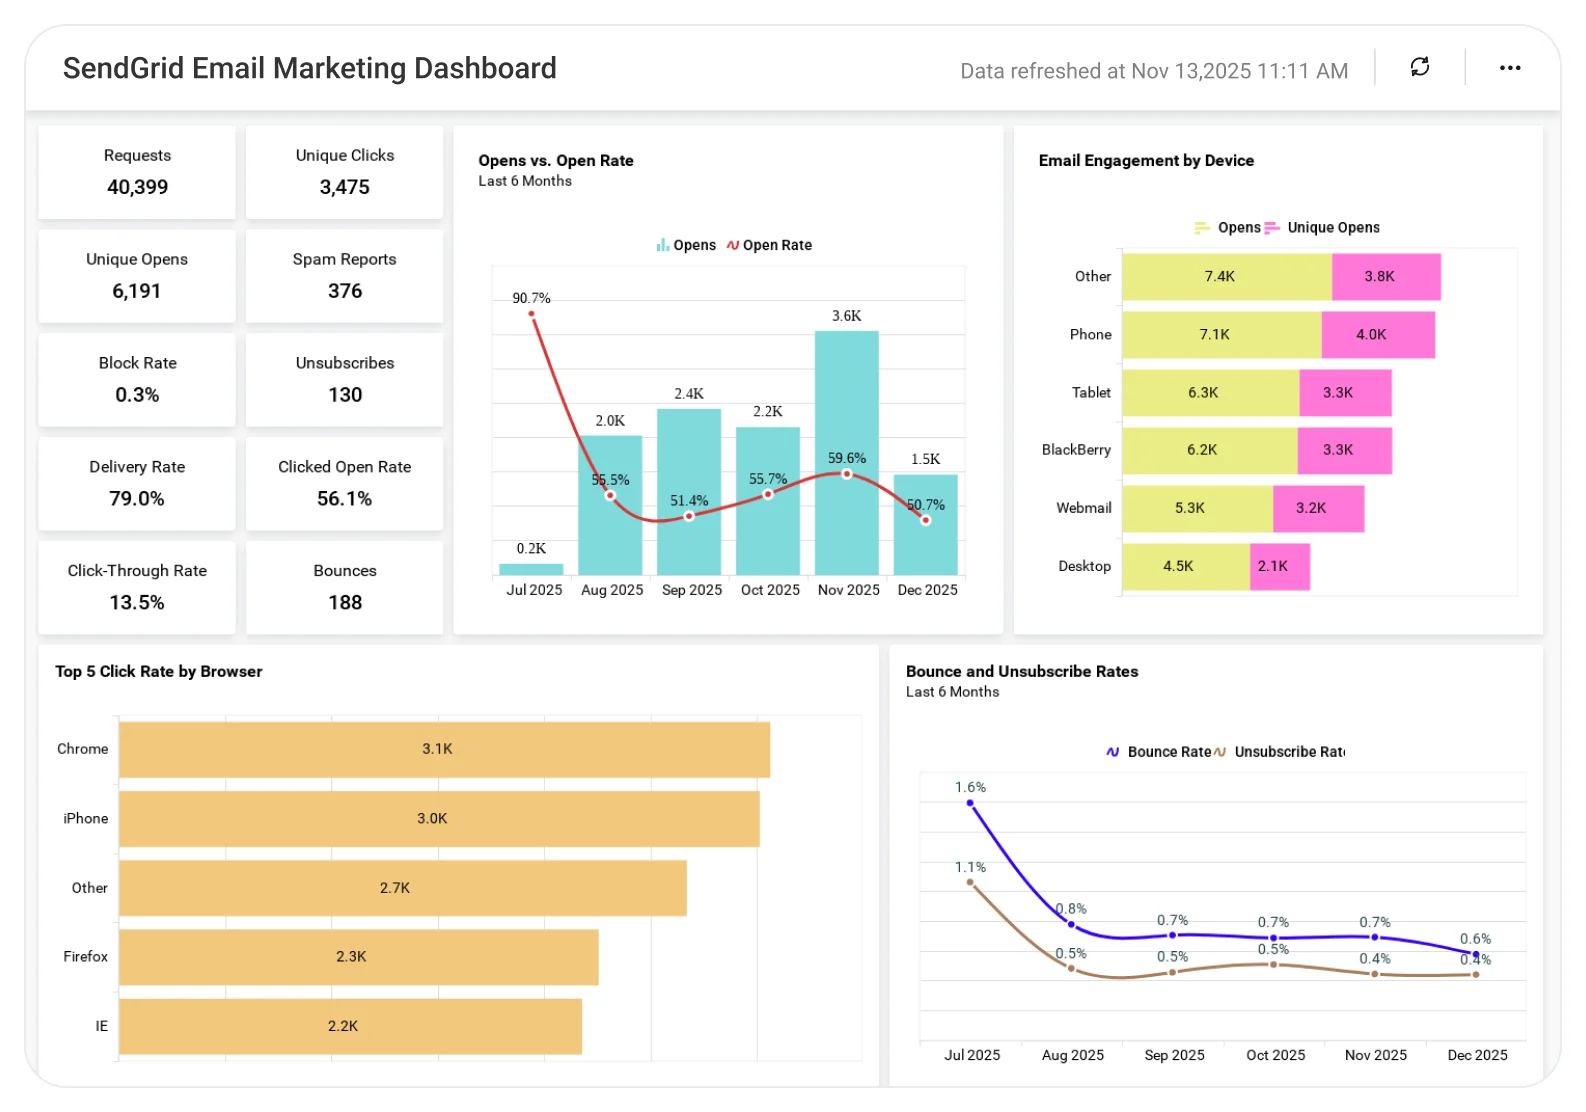
SendGrid Email Marketing Dashboard

Understand email campaign performance to improve engagement and conversions.

The Email Marketing Dashboard helps teams analyze open rates, click-through rates, conversions, and campaign effectiveness, enabling better content optimization, audience targeting, and overall email marketing results.

TL;DR

  • Total email requests, opens, and clicks.  
  • Delivery rate, spam reports, and unsubscribe counts.
  • Click performance by browser.
  • Opens and unique opens by device.
  • Monthly and country-level engagement trends.

What Is an Email Marketing Dashboard?

An Email Marketing Dashboard is a visual analytics tool that tracks email campaign engagement metrics such as opens, clicks, delivery rates, and unsubscribes. 

In Bold BI, this means interactive dashboards that consolidate email performance data into clear charts, KPIs, and trends which are updated automatically. 

Why Email Marketing Dashboard Matters

Email marketing success depends on understanding how, when, and where users engage. 

Without a centralized dashboard: 

  • Engagement trends are hard to spot.
  • Unsubscribe spikes go unnoticed.
  • Campaign performance varies by device or browser without explanation.
  • Optimization decisions rely on assumptions instead of data.

Bold BI converts raw SendGrid email metrics into actionable insights, marketers can use to improve campaigns. 

What You’ll Track

  • Core email engagement metrics: Track total requests, opens, clicks, delivery rate, spam reports, and unsubscribe counts.
  • Browser-level click performance:Analyze click percentages by browser to optimize rendering and compatibility.  
  • Device-based engagement: Compare opens and unique opens across desktop, mobile, and other devices.
  • Geographic & time-based trends: Monitor opens by country and analyze monthly engagement patterns.

All dashboards are fully customizable so you can add KPIs or metrics as needed.   

How It Works

  • Connect your SendGrid email platforms, marketing databases, or CSV, Excel, Rest APIs, SQL data.
  • Apply the Email Marketing Dashboard sample.
  • Filter performance using the Period date filter.
  • Analyze engagement by browser, device, country, and month.
  • Share dashboards with marketers, analysts, and executives.

Why Bold BI Is the Right Fit for SendGrid Email Marketing Analytics

Bold BI is designed for modern, data-driven marketing teams that rely on performance metrics. 

With Bold BI, you can: 

  • Monitor opens, clicks, and unsubscribes in real time.
  • Break down engagement by browser, device, and geography.
  • Track campaign performance trends over time.
  • Share dashboards securely with marketing and leadership teams.
  • Deploy dashboards in cloud or self-hosted environments.

Compare Options (at a glance)

Feature Bold BI Email Tool Reports Spreadsheets
Open & click tracking Yes Yes Manual
Browser & device analysis Yes Limited Manual
Trend analysis Yes Partial Manual
Interactive filtering Yes No Manual
Deployment Cloud / self-hosted SaaS only Local

Frequently Asked Questions

Yes. The Period filter lets you analyze performance for any selected time frame.
Yes. Unsubscribes and spam reports are clearly highlighted alongside engagement metrics.
Absolutely. Device and browser-level charts help identify performance differences.
Yes. Bold BI supports RLS, Single Sign-On, and Role-Based Access Control, and audit logs to keep your marketing data secure.
Yes. Bold BI supports secure embedding into internal marketing tools and portals.
Yes. Add or modify KPIs, widgets, and filters to match your email marketing goals.

Compare Options (at a glance)

Feature Bold BI Email Tool Reports Spreadsheets
Open & click tracking Yes Yes Manual
Browser & device analysis Yes Limited Manual
Trend analysis Yes Partial Manual
Interactive filtering Yes No Manual
Deployment Cloud / self-hosted SaaS only Local

Simple Pricing That Grows With You

Say goodbye to hidden costs, complex quotes, and pricing guesswork. 

Trusted by Users. Recognized by Experts.

Don't take our word for it

Here are a few kind words from some of our happy customers.

Software Advice

Frequently Asked Questions

Yes. The Period filter lets you analyze performance for any selected time frame.
Yes. Unsubscribes and spam reports are clearly highlighted alongside engagement metrics.
Absolutely. Device and browser-level charts help identify performance differences.
Yes. Bold BI supports RLS, Single Sign-On, and Role-Based Access Control, and audit logs to keep your marketing data secure.
Yes. Bold BI supports secure embedding into internal marketing tools and portals.
Yes. Add or modify KPIs, widgets, and filters to match your email marketing goals.

Start your 30-day free trial instantly

Easy integration, AI-Powered Dashboards and 24x5 real-time support.