Industry : Pharmaceutical Analytics

Pharmaceutical Production Analysis Dashboard

Understand pharmaceutical production performance to improve efficiency and output quality.

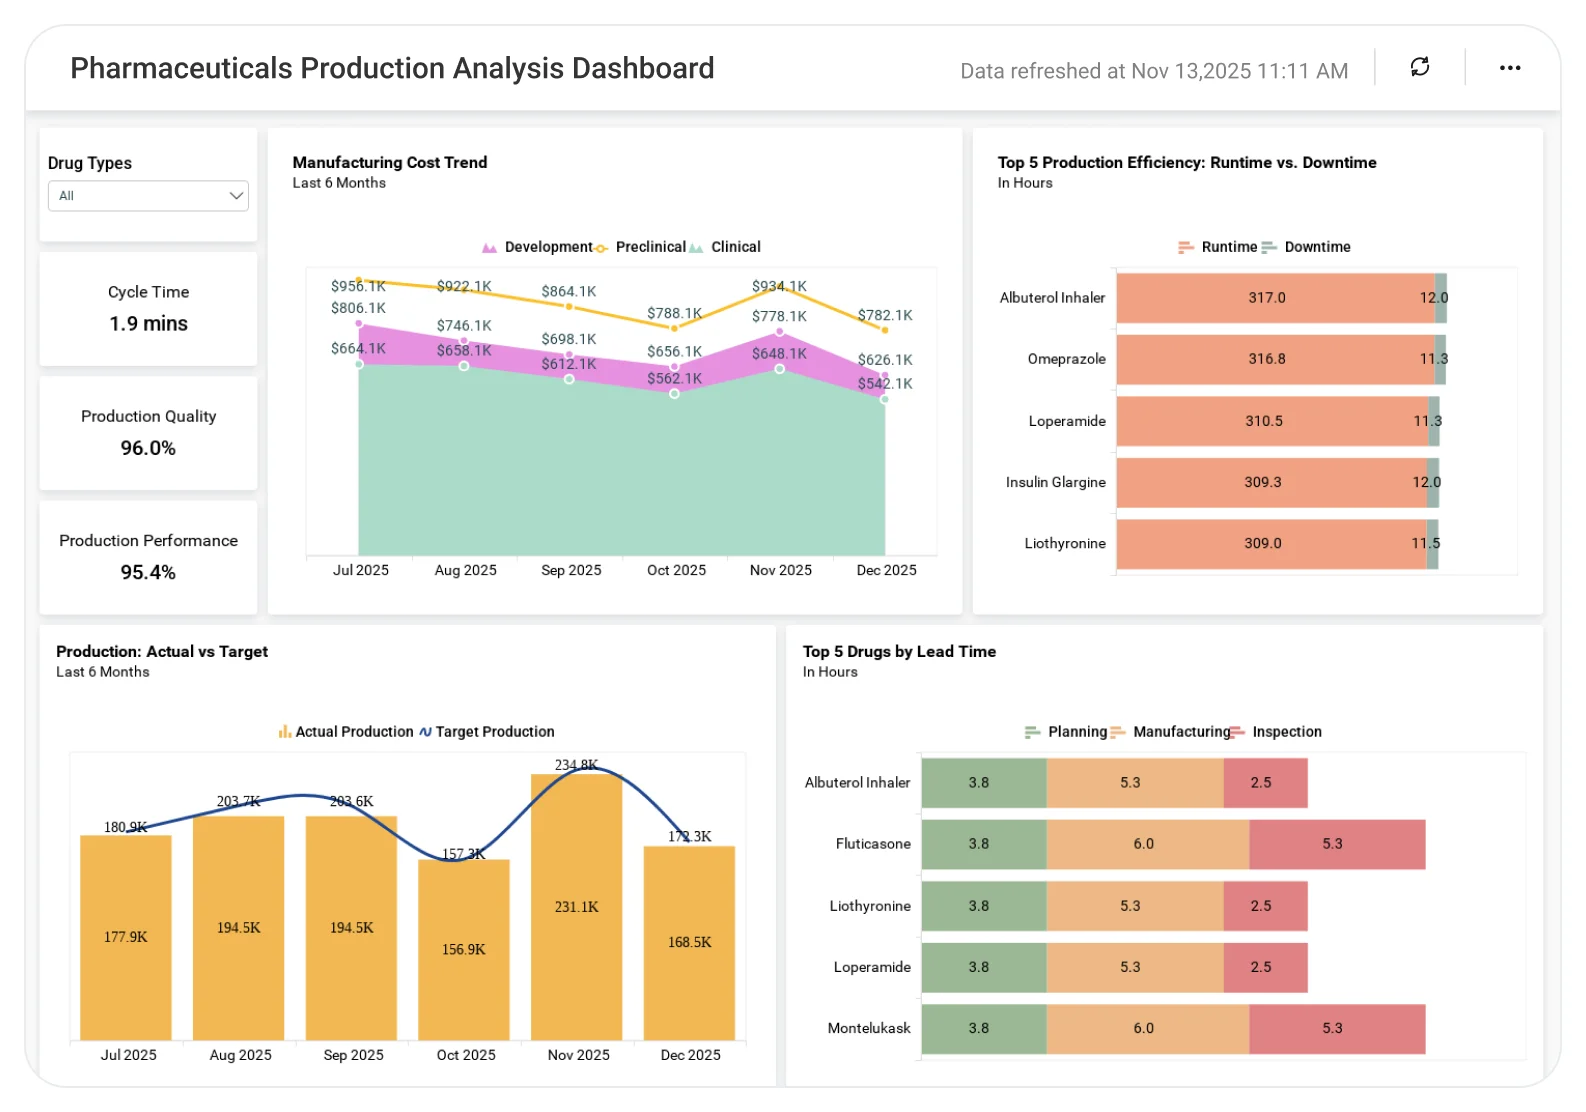
The Pharmaceutical Production Analysis Dashboard helps teams analyze production volumes, batch performance, downtime, and efficiency trends, enabling better production planning, reduced waste, and more reliable manufacturing outcomes.

TL;DR

  • Takt time changes by drug.
  • Drug rankings based on quality metrics.
  • Production costs across development stages.
  • Production versus target performance.
  • Plant-wise and quarter-wise production insights.

What Is a Pharmaceutical Production Analysis Dashboard?

A Pharmaceutical Production Analysis Dashboard is a visual analytics solution that helps manufacturers monitor production efficiency, quality compliance, and cost distribution across drugs and plants.

In Bold BI, it becomes an interactive dashboard with KPIs, charts, grids, and filters that automatically update from production data sources.

Why Pharmaceutical Production Analysis Dashboard Matters

Pharmaceutical manufacturing depends on precise control of time, quality, and cost. 

Without a centralized dashboard: 

  • Production inefficiencies remain hidden.
  • Quality issues surface late in the process.
  • Cost overruns across deployment stages are hard to trace.

Bold BI brings production, quality, and cost metrics into one dashboard so teams can monitor performance and plan production more effectively. 

What You’ll Track

  • Production efficiency: Takt time and its month-over-month changes to measure demand alignment and resource utilization.
  • Quality performance: LAR (Lost Acceptance Rate) and PQCR (Production Quality Complaint Rate) rankings across drugs.
  • Production lead time: Time taken across different phases of drug manufacturing to evaluate process bottlenecks.
  • Manufacturing costs: Cost incurred during development, preclinical, and clinical phases for each drug.
  • Production output vs targets: Comparison of actual units produced against targets across quarters and plants.

All dashboards are fully customizable, allowing you to add KPIs or metrics as needed.

How It Works

  • Connect manufacturing systems, production data, quality metrics, or exported Excel or SQL sources.
  • Select the Pharmaceutical Production Analysis Dashboard sample.
  • Blend production volume, quality metrics, cost, time, and plant-level data in one view.
  • Share role-based dashboards with production heads, quality teams, and leadership.
  • Monitor production efficiency, control costs, and improve output planning.

Why Bold BI Is the Right Fit for Pharmaceutical Production Analytics

  • Connect production and quality data easily: Integrates manufacturing systems, quality logs, cost data, Excel or SQL sources.
  • Centralize production performance reporting: Combines takt time, lead time, quality metrics, and cost data in one dashboard.
  • Support multi-plant analysis: Enables comparison across multiple manufacturing plants and quarters.
  • Enable operational drill downs: Designed for plant-level, drug-level, and phase-level analysis.
  • Deploy flexibly: Supports cloud and self-hosted environments for regulated manufacturing setups.

Compare Options (at a glance)

Feature Bold BI Production Analysis Dashboard Manufacturing Reports Spreadsheets
Takt & lead time tracking  Yes Limited Manual
Quality metrics analysis  Yes Limited Manual
Phase-wise cost visibility  Yes Limited Manual
Production vs target comparison  Yes Limited Manual
Interactive plant-level analysis  Yes Limited No

Frequently Asked Questions

Yes. Takt time KPIs display month-over-month changes for each drug.
Yes. Drugs can be compared using LAR and PQCR quality metrics.
Yes. Costs are broken down by deployment, preclinical, and clinical phases.
Yes. Plant-level filters allow focused analysis of selected manufacturing units.
Yes. The Production vs Target view shows actual units against planned targets.
By combining time, quality, cost, and output metrics, teams can plan capacity and optimize production.

Compare Options (at a glance)

Feature Bold BI Production Analysis Dashboard Manufacturing Reports Spreadsheets
Takt & lead time tracking  Yes Limited Manual
Quality metrics analysis  Yes Limited Manual
Phase-wise cost visibility  Yes Limited Manual
Production vs target comparison  Yes Limited Manual
Interactive plant-level analysis  Yes Limited No

Simple Pricing That Grows With You

Say goodbye to hidden costs, complex quotes, and pricing guesswork. 

Trusted by Users. Recognized by Experts.

Don't take our word for it

Here are a few kind words from some of our happy customers.

Software Advice

Frequently Asked Questions

Yes. Takt time KPIs display month-over-month changes for each drug.
Yes. Drugs can be compared using LAR and PQCR quality metrics.
Yes. Costs are broken down by deployment, preclinical, and clinical phases.
Yes. Plant-level filters allow focused analysis of selected manufacturing units.
Yes. The Production vs Target view shows actual units against planned targets.
By combining time, quality, cost, and output metrics, teams can plan capacity and optimize production.

Start your 30-day free trial instantly

Easy integration, AI-Powered Dashboards and 24x5 real-time support.