Industry : Telecommunications

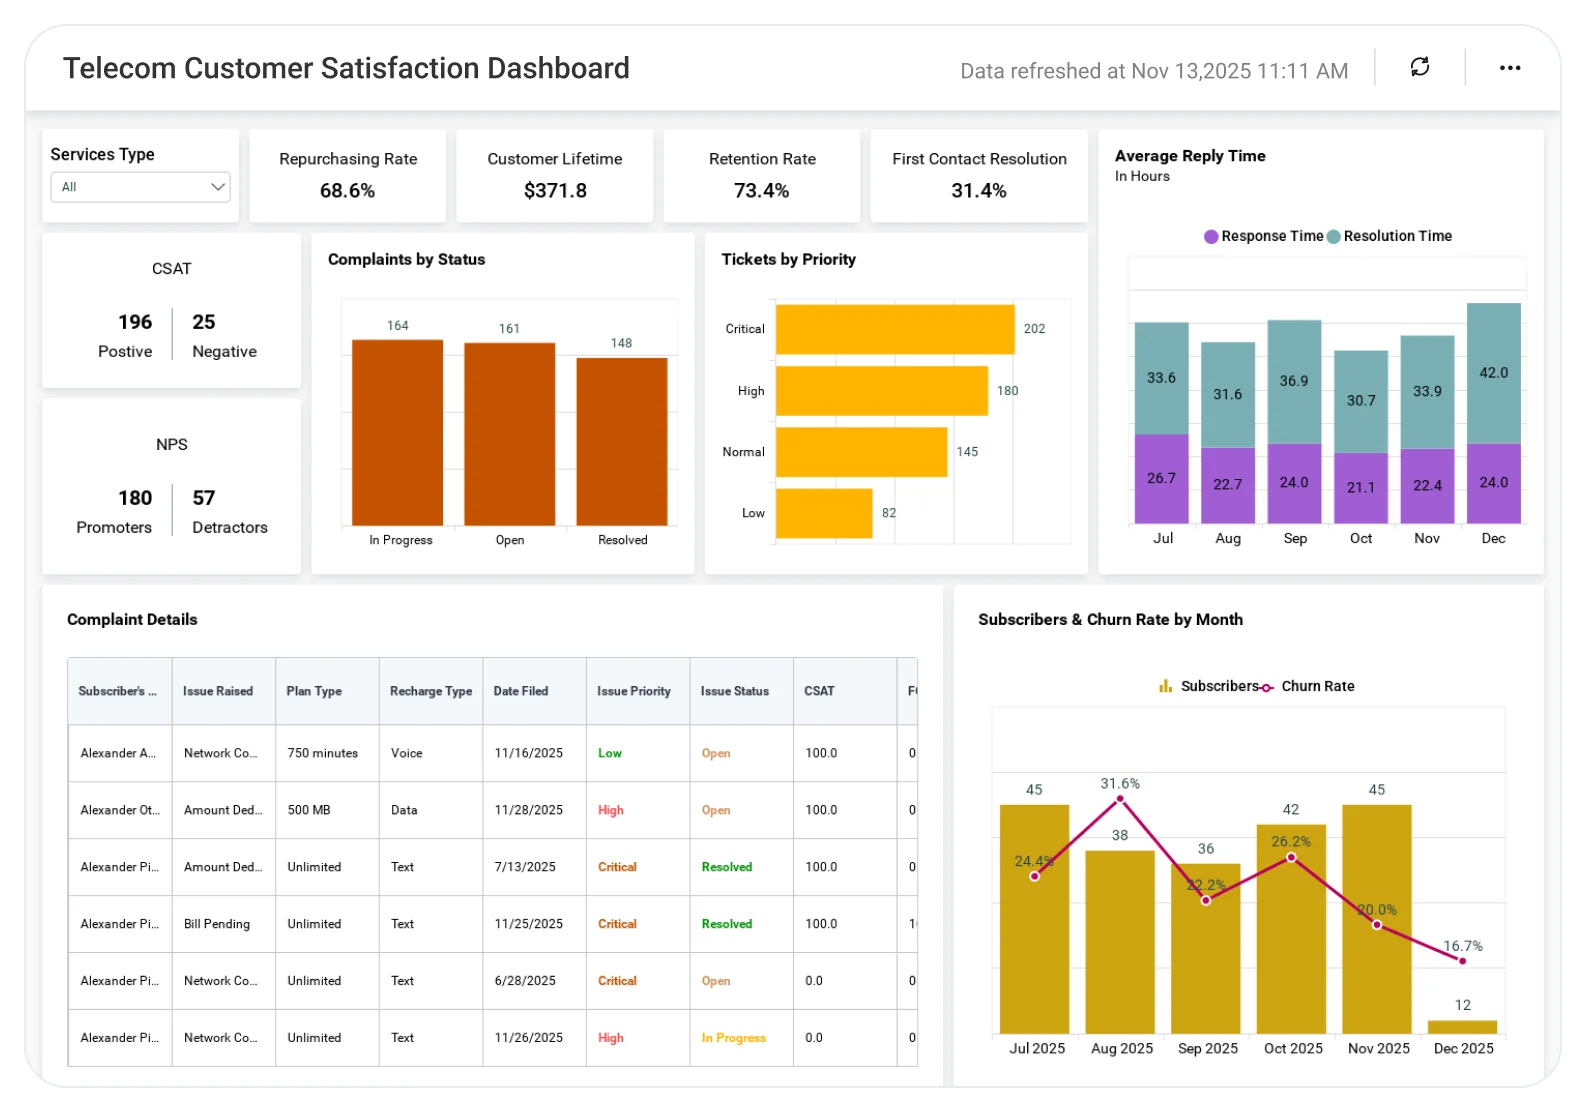
Telecom Customer Satisfaction Dashboard

Improve customer satisfaction by understanding service experience and feedback trends.

The Telecom Customer Satisfaction Dashboard helps teams analyze customer feedback, service quality metrics, and satisfaction scores, enabling targeted improvements that reduce churn and strengthen customer loyalty.

TL;DR

  • Customer satisfaction rate calculated from support ticket resolution.
  • Customer-wise purchase and recharge details.
  • Network usage by data, voice, and messaging.
  • Open, in-progress, and resolved support tickets.
  • Customer-level and overall service insights.

What Is a Telecom Customer Satisfaction Dashboard?

A Telecom Customer Satisfaction Dashboard is a visual analytics solution that helps telecom companies track customer happiness, service usage, and support performance in real time. 

In Bold BI, it becomes an interactive dashboard with KPIs, charts, tables, and filters automatically updated from customer service and usage data sources. 

Why Telecom Customer Satisfaction Dashboard Matters

Customer experience is a key differentiator in the telecom industry. 

Without a centralized dashboard: 

  • Unresolved support issues go unnoticed.
  • High-risk customers are not prioritized.
  • Usage behavior is disconnected from service strategy.

Bold BI brings customer activity, satisfaction, and support data together so teams can respond faster to support issues and reduce customer churn risk. 

What You’ll Track

  • Customer satisfaction score: Satisfaction rate calculated from open, in-progress, and resolved support tickets.
  • Recharge and purchase behavior: Detailed view of customer spending, recharge history, and purchased services.
  • Service usage patterns: Data, voice, and messaging usage to understand how customers consume services.
  • Support ticket status: Number of open, in-progress, and resolved tickets to monitor service quality.
  • Customer-level comparisons: Analyze individual customers or overall performance using customer number filters.

All dashboards are fully customizable, allowing you to add KPIs or metrics as needed.

How It Works

  • Connect telecom CRM, billing, support ticket systems, or exported Excel or SQL data.
  • Select the Telecom Customer Satisfaction Dashboard sample.
  • Blend customer usage, recharge details, support tickets, and satisfaction data in one view.
  • Share role-based dashboards with customer service, operations, and leadership teams.
  • Monitor satisfaction trends, prioritize issue resolution, and improve customer experience.

Why Bold BI Is the Right Fit for Telecom Customer Satisfaction Analytics

  • One source of truth for satisfaction, usage, and support data.
  • Clear visibility into unresolved customer issues.
  • Easy analysis of customer purchases and usage behavior.
  • Better prioritization of support tickets.
  • Dashboards built for customer retention and service improvement.

Compare Options (at a glance)

Feature Bold BI Telecom Customer Satisfaction Dashboard CRM Reports Spreadsheets
Customer satisfaction tracking  Yes Limited Manual
Recharge & purchase visibility  Yes Limited Manual
Network usage insights  Yes Limited Manual
Support ticket monitoring  Yes Limited Manual
Customer-level filtering  Yes Limited No

Frequently Asked Questions

Yes. Users can view data for a specific customer or for all customers combined.
Satisfaction is based on the ratio of resolved tickets to total support tickets.
Yes. Recharge and purchase details show services, dates, and spending amounts.
Customers with lower satisfaction and more unresolved tickets can be identified quickly.
Yes. Data, voice, and messaging usage are tracked for each customer.
Most teams can connect data and begin monitoring customer satisfaction within a few hours.

Compare Options (at a glance)

Feature Bold BI Telecom Customer Satisfaction Dashboard CRM Reports Spreadsheets
Customer satisfaction tracking  Yes Limited Manual
Recharge & purchase visibility  Yes Limited Manual
Network usage insights  Yes Limited Manual
Support ticket monitoring  Yes Limited Manual
Customer-level filtering  Yes Limited No

Simple Pricing That Grows With You

Say goodbye to hidden costs, complex quotes, and pricing guesswork. 

Trusted by Users. Recognized by Experts.

Don't take our word for it

Here are a few kind words from some of our happy customers.

Software Advice

Frequently Asked Questions

Yes. Users can view data for a specific customer or for all customers combined.
Satisfaction is based on the ratio of resolved tickets to total support tickets.
Yes. Recharge and purchase details show services, dates, and spending amounts.
Customers with lower satisfaction and more unresolved tickets can be identified quickly.
Yes. Data, voice, and messaging usage are tracked for each customer.
Most teams can connect data and begin monitoring customer satisfaction within a few hours.

Start your 30-day free trial instantly

Easy integration, AI-Powered Dashboards and 24x5 real-time support.