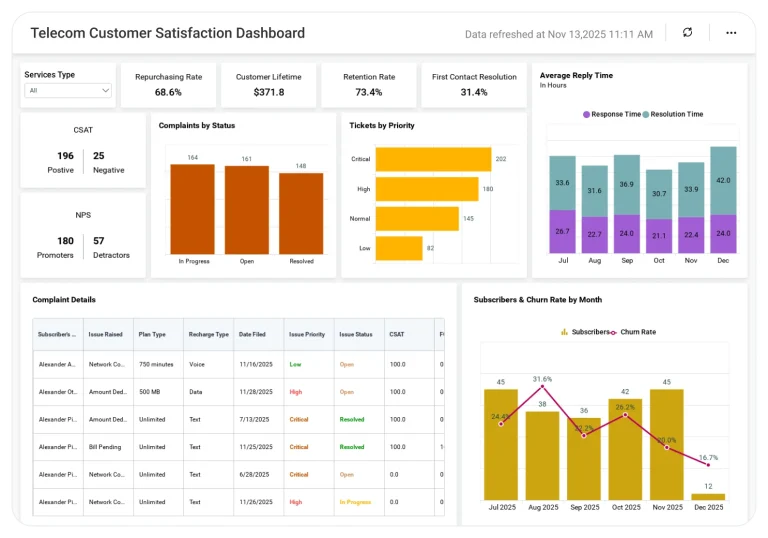
Telecom Management Dashboard
Understand telecom operations to improve service quality and operational efficiency.
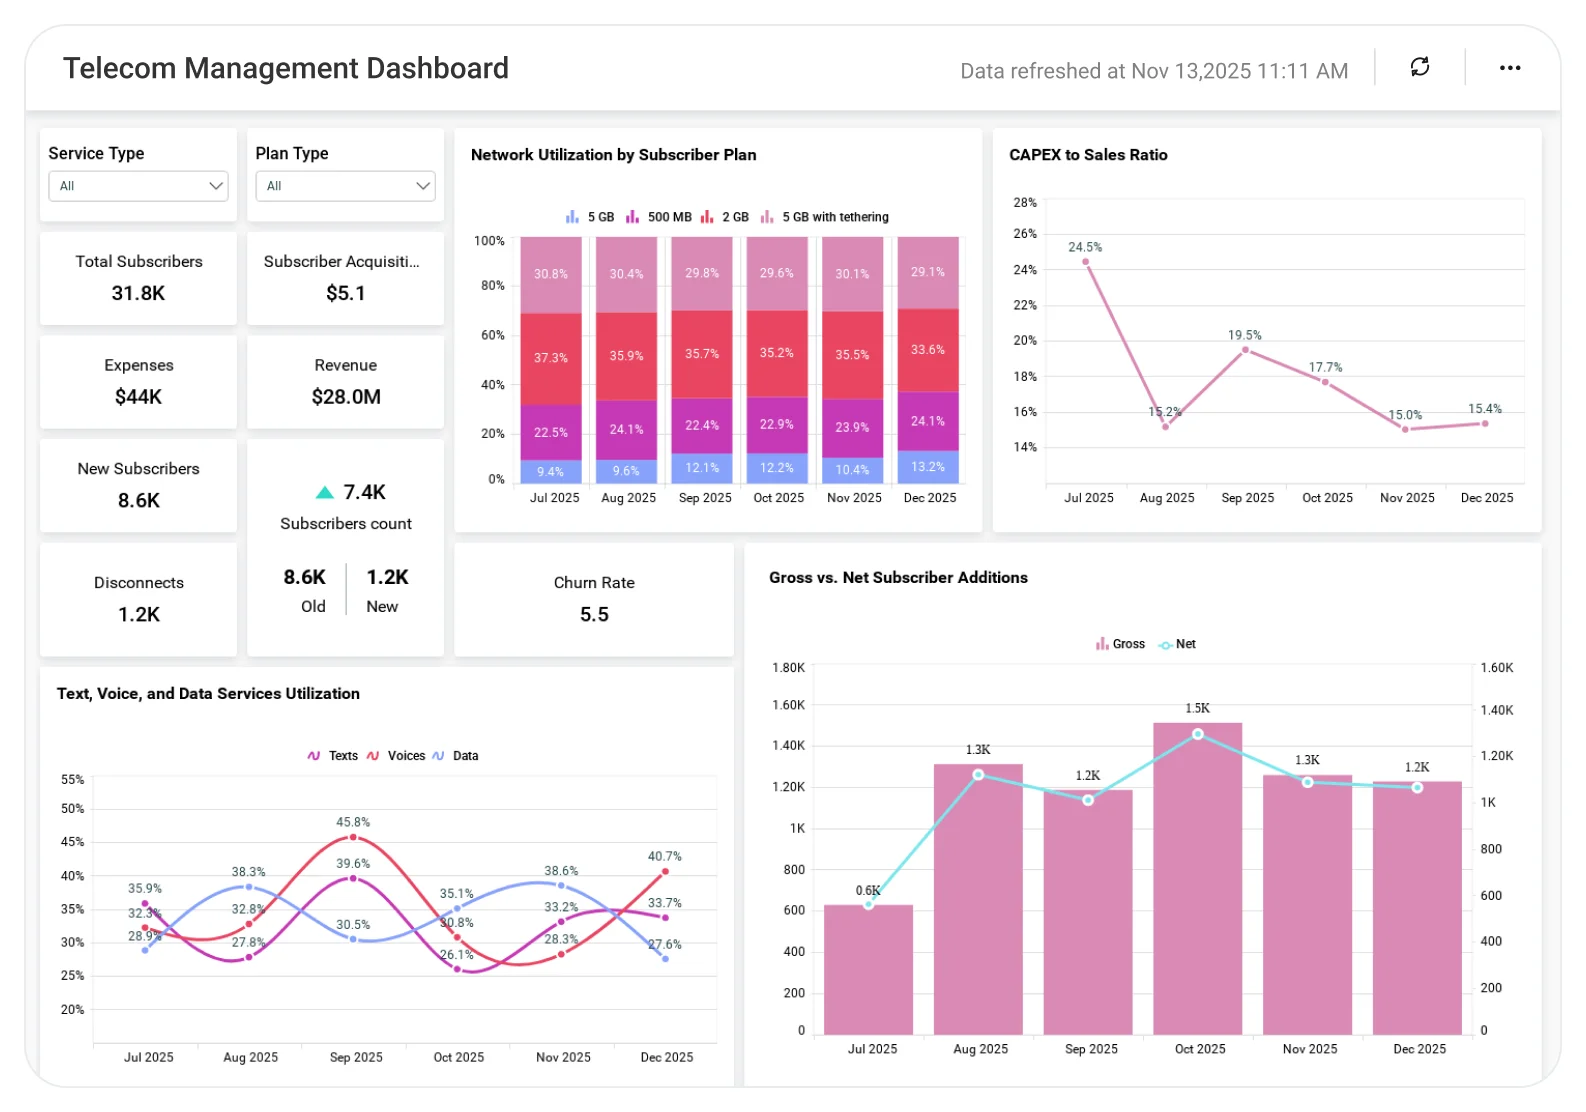
The Telecom Management Dashboard helps teams analyze network performance, service usage, revenue trends, and customer activity, enabling better operational planning, cost control, and improved customer experience.
TL;DR
-
Revenue versus expense overview.
-
Total subscribers and customer churn rates.
-
Fixed line vs. mobile subscriber distribution.
-
Service usage across voice, data, and text.
-
Network utilization trends by subscriber type.
What Is a Telecom Management Dashboard?
A Telecom Management Dashboard is a visual analytics solution that helps telecom companies monitor financial health, subscriber behavior, service usage, and network load in real time.
In Bold BI, it becomes an interactive dashboard with KPIs, charts, drilldowns, and filters that automatically update from telecom data sources.
Why Telecom Management Dashboard Matters
Telecom companies operate in a high-volume, high-demand environment where profitability and network performance are closely linked.
Without a centralized dashboard:
-
Revenue and expense trends are hard to compare.
-
Subscriber churn goes unnoticed until it impacts growth.
-
Network congestion risks are difficult to identify early.
Bold BI brings financial, subscriber, and usage data together so telecom teams can make timely, data-driven decisions.
What You’ll Track
-
Financial performance: Total revenue, total expenses, and revenue-versus-expense comparisons to monitor profitability.
-
Subscriber growth & churn: Total subscribers, customer churn rate, and subscriber changes over time.
-
Service mix & plan performance: Fixed line vs. mobile subscribers, prepaid vs. postpaid usage, and average revenue per user by plan.
-
Service utilization: Voice, data, and text usage trends to understand which services customers rely on most.
-
Network utilization insights: Network usage by subscriber type to identify heavily taxed network segments and capacity needs.
All dashboards are fully customizable, allowing you to add KPIs or metrics as needed.
How It Works
-
Select the Telecom Management Dashboard sample.
-
Blend revenue, expenses, subscriber, churn, and network usage data in one view.
-
Share role-based dashboards with operations, finance, and leadership teams.
-
Monitor performance trends, optimize resources, and improve subscriber retention.
Why Bold BI Is the Right Fit for Telecom Management Analytics
-
Centralize business and network reporting: Combines revenue, expenses, subscribers, churn, and utilization metrics in one dashboard.
-
Support detailed analysis: Enables drilldowns from high-level KPIs to plan-level and service-level insights. Easy drilldowns from company-level KPIs to plan-level details.
-
Enable operational visibility: Designed for ongoing monitoring of financial and network performance.
-
Deploy flexibly: Supports cloud and self-hosted deployment environments to match telecom infrastructure needs.
Compare Options (at a glance)
| Feature | Bold BI Telecom Management Dashboard | Telecom Reports | Spreadsheets |
| Revenue & expense tracking | Yes | Limited | Manual |
| Subscriber & churn analysis | Yes | Limited | Manual |
| Service usage insights | Yes | Limited | Manual |
| Network utilization monitoring | Yes | Limited | Manual |
| Interactive dashboards for leadership | Yes | Limited | No |
Frequently Asked Questions
More Articles About Telecom Dashboard
-
Telecom Network Optimization with Business Intelligence
This blog shows how Bold BI® helps telecom teams optimize network performance using BI dashboards for better monitoring and decisions.
-
Monitor & Expand Your Telecom Business by Embedded Analytics
This blog shows how Bold BI® uses embedded analytics to help telecom businesses monitor key metrics and improve decision-making for growth.
-
Maximize Telecom Revenue Using Embedded Analytics
This blog shows how Bold BI® uses embedded analytics to help telecom companies track key revenue metrics and improve decision-making for higher profitability.