Project Management Dashboard
Deliver IT projects on time and within scope by aligning progress, resources, and risks.
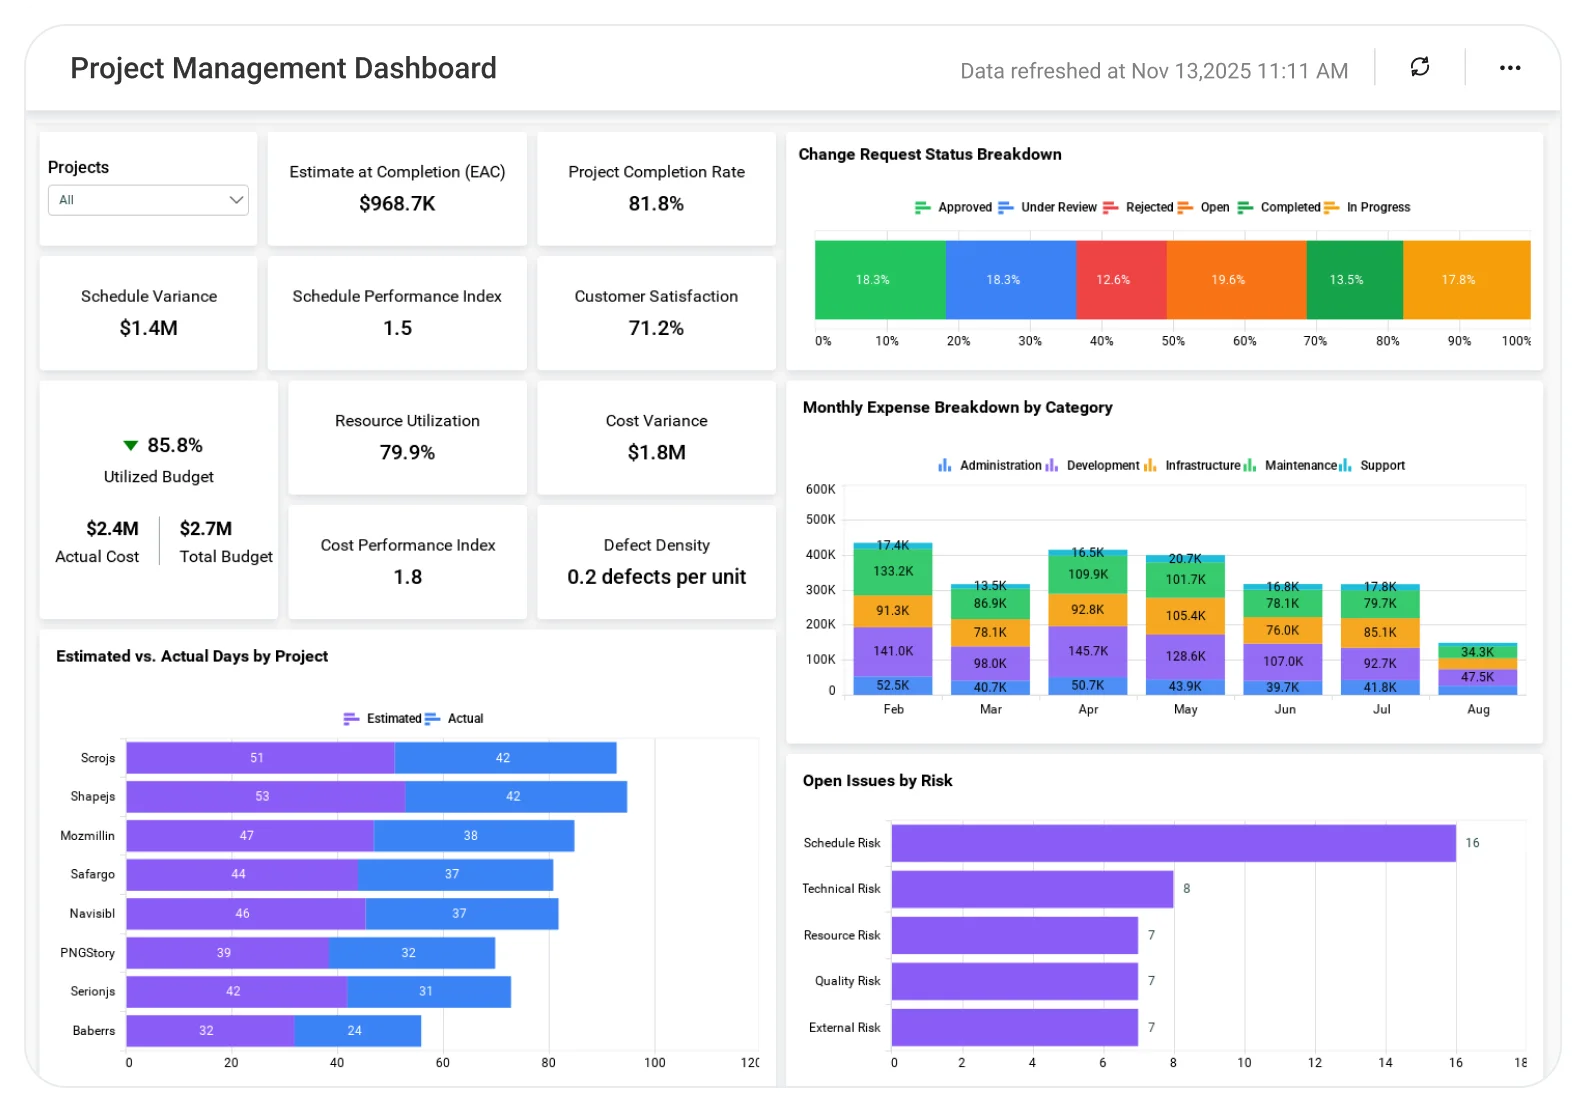
The Project Management Dashboard helps teams analyze timelines, task completion, resource allocation, and project risks, enabling better planning, proactive issue resolution, and predictable project outcomes.
TL;DR
-
Total investment vs. billed revenue.
-
Monthly expenses and revenue trends.
-
Project completion and time allocation.
-
Customer satisfaction with the project.
-
SLA compliance, risk, and breach visibility.
What Is a Project Management Dashboard?
A Project Management Dashboard visualizes project finances, delivery status, and customer satisfaction in one place.
In Bold BI, this means interactive KPIs, charts, and tables that connect financial performance with project execution and SLA outcomes.
Why Project Management Dashboard Matters
Project success depends on more than timelines; it depends on financial discipline and customer satisfaction.
Without a centralized dashboard:
-
Project costs drift without visibility.
-
Profitable and unprofitable projects look the same.
-
SLA risks are discovered too late.
-
Customer satisfaction trends remain unclear.
Bold BI delivers one operational and financial view, helping IT teams balance delivery timelines, profitability, and SLA commitments.
What You’ll Track
-
Financial performance & investment: Monitor total investment, billed amount, monthly expenses, and revenue trends.
-
Project status & time allocation: Track project completion progress and total days spent per project.
-
Customer satisfaction by project:Identify which projects delight customers and where improvement is needed.
-
SLA compliance & risk: Analyze SLA status by project, met, at risk, or breached using clear visual indicators.
All dashboards are fully customizable so you can add KPIs or metrics as needed.
How It Works
-
Connect project management, finance, or ERP data sources.
-
Apply the Project Management Dashboard sample.
-
Analyze financials, projects, and SLAs in one view.
-
Track trends and performance over time.
-
Share dashboards with IT leaders and project managers.
Why Bold BI Is the Right Fit for Project Management
-
Unified project intelligence: Track financials, project progress, customer satisfaction, and SLA performance in one centralized dashboard.
-
Profitability & delivery control: Compare project investments with billed revenue, monitor expenses, and keep timelines and effort distribution on track.
-
Proactive risk management: Identify service gaps and at-risk SLAs early to prevent breaches and improve customer outcomes.
-
Executive-ready visibility: Clear, interactive dashboards designed for IT leaders and delivery teams.
-
Secure & embeddable analytics: Protect data with Row Level Security(RLS), Single Sign On(SSO), and Role Based Access Control(RBAC), and embed dashboards into IT operations portals.
-
Flexible deployment: Deploy securely in cloud or self-hosted environments to meet IT and compliance requirements.
Compare Options (at a glance)
| Feature | Bold BI | Project Reports | Spreadsheets |
| Project financial visibility | Yes | Partial | Manual |
| Time & completion tracking | Yes | Limited | Manual |
| SLA & satisfaction analytics | Yes | Limited | Manual |
| Executive-ready insights | Yes | No | No |
| Deployment | Cloud / self-hosted | SaaS only | Local |
Frequently Asked Questions
More Articles About Project Management Dashboard
-
Increase Project Efficiency and Maximize ROI with Embedded Analytics
 Shows how embedded analytics delivers real-time insights to improve project efficiency and boost return on investment.
-
Visualizing and Managing Projects with Bar Charts
Explains how bar charts simplify project tracking, helping teams monitor progress and allocate resources effectively.