
Pipedrive Sales KPI Dashboard
Focus on key sales metrics to improve performance and achieve revenue targets.
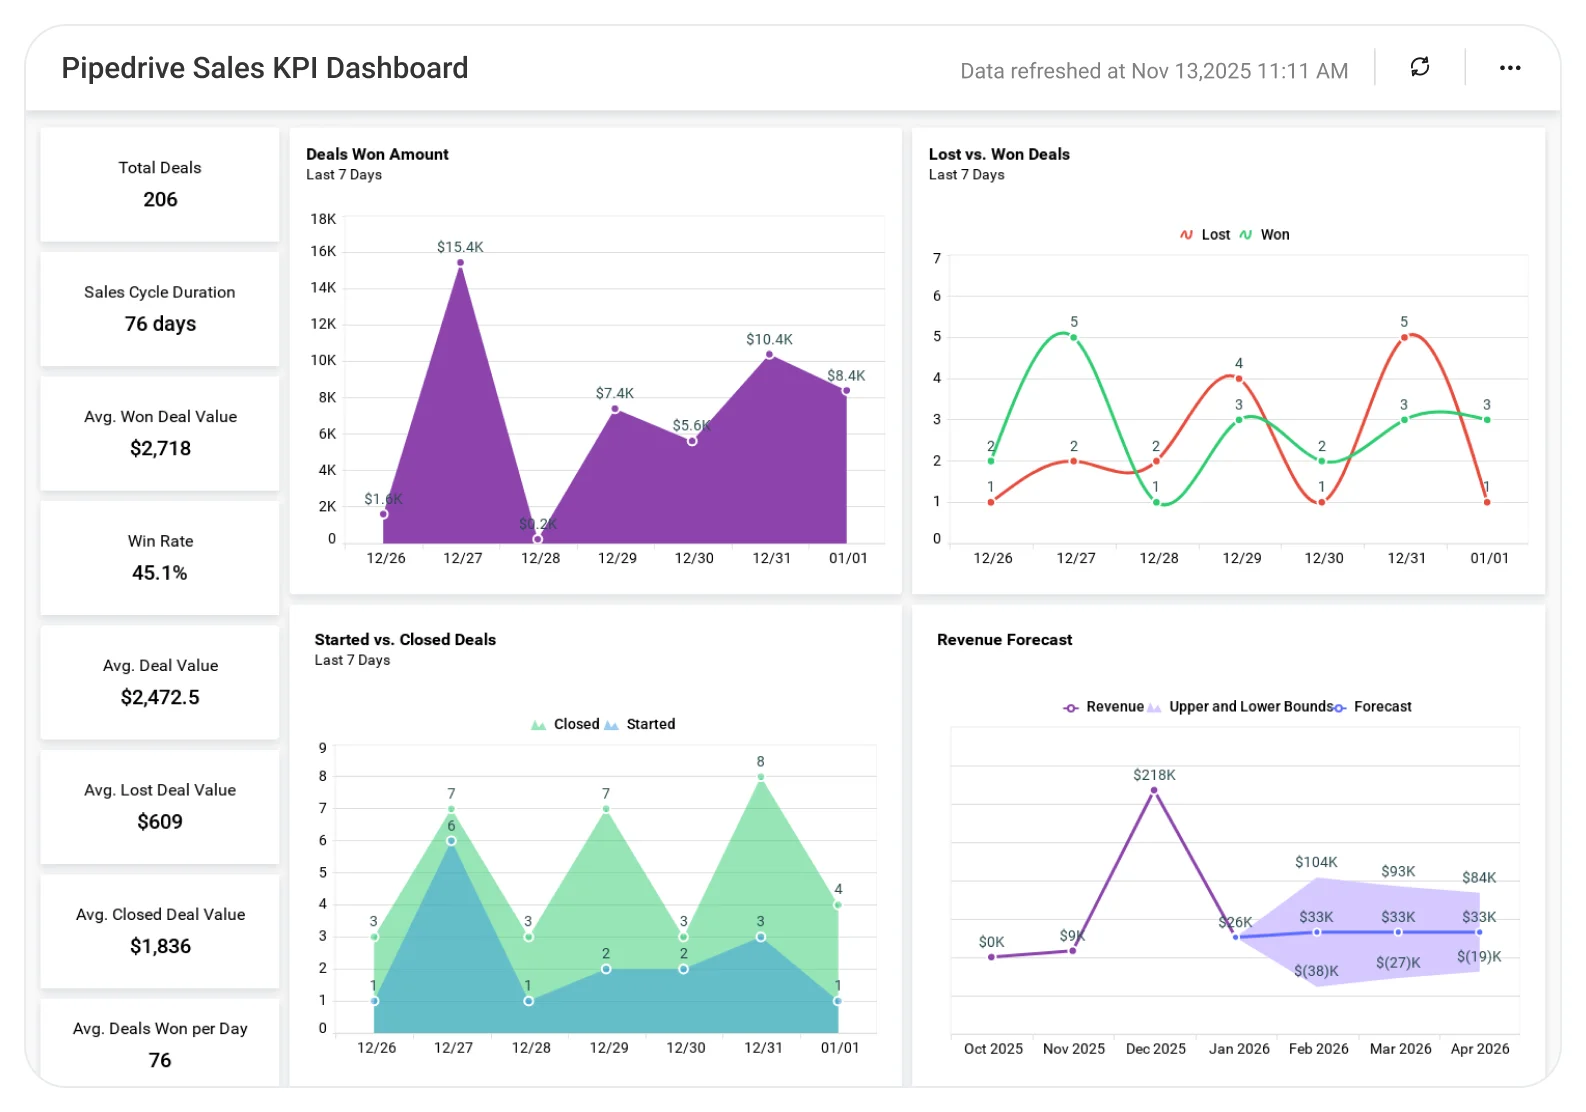
The Sales KPI Dashboard helps teams track critical sales indicators such as targets, conversions, pipeline value, and team performance, enabling quick insights, better alignment, and data-driven sales decisions.
TL;DR
-
Deals won, lost, and in progress.
-
Total deal value and average deal size.
-
Average time to close a deal.
-
Monthly sales and revenue trends.
-
Short-term revenue forecast.
What Is a Sales KPI Dashboard?
A Sales KPI Dashboard is a visual analytics solution that helps organizations measure sales performance using key indicators such as win rate, deal value, sales cycle length, and revenue trends.
In Bold BI, it becomes an interactive dashboard with KPIs, charts, and forecasts automatically updated from sales data sources.
Why Sales KPI Dashboard Matters
Sales performance depends on visibility into deals, value, and velocity.
Without a centralized sales dashboard:
-
Win and loss trends are hard to measure.
-
Sales cycle inefficiencies remain hidden.
-
Revenue forecasting becomes unreliable.
Bold BI brings all critical sales KPIs into one dashboard so teams can track performance and make data-driven sales decisions.
What You’ll Track
-
Deal outcomes: Number of deals won, lost, and currently in the pipeline.
-
Deal value analysis: Total deal amounts and average sale value.
-
Sales cycle efficiency: Average number of days required to close a deal.
-
Performance trends: Monthly trends for deals won, lost, and revenue.
-
Revenue forecasting: Projected revenue for upcoming months based on historical data.
All dashboards are fully customizable, allowing you to add KPIs or metrics as needed.
How It Works
-
Apply the Sales KPI Dashboard sample instantly.
-
Combine deals, revenue, pipeline, and time-based data in one view.
-
Share dashboards securely with sales managers and leadership teams.
-
Act on performance and revenue trends to improve close rates and forecasting.
Why Bold BI Is the Right Fit for Pipedrive Sales KPI Analytics
Sales teams choose Bold BI because it delivers clear visibility into deal performance and revenue growth.
-
Centralized sales performance tracking: View deals, revenue, pipeline, and cycle metrics in one dashboard.
-
Trend and forecast analysis: Evaluate past performance and anticipate future results.
-
Actionable insights for reviews: Support sales reviews, forecasting, and leadership reporting.
-
Flexible deployment options: Use cloud or self-hosted environments to suit sales organizations.
Compare Options (at a glance)
| Feature | Bold BI Sales KPI Dashboard | CRM Reports | Spreadsheets |
| Deals won & lost tracking | Yes | Limited | Manual |
| Average deal size & cycle | Yes | Limited | Manual |
| Sales trend analysis | Yes | Limited | Manual |
| Revenue forecasting | Yes | Limited | No |
| Executive-ready dashboards | Yes | Limited | No |


