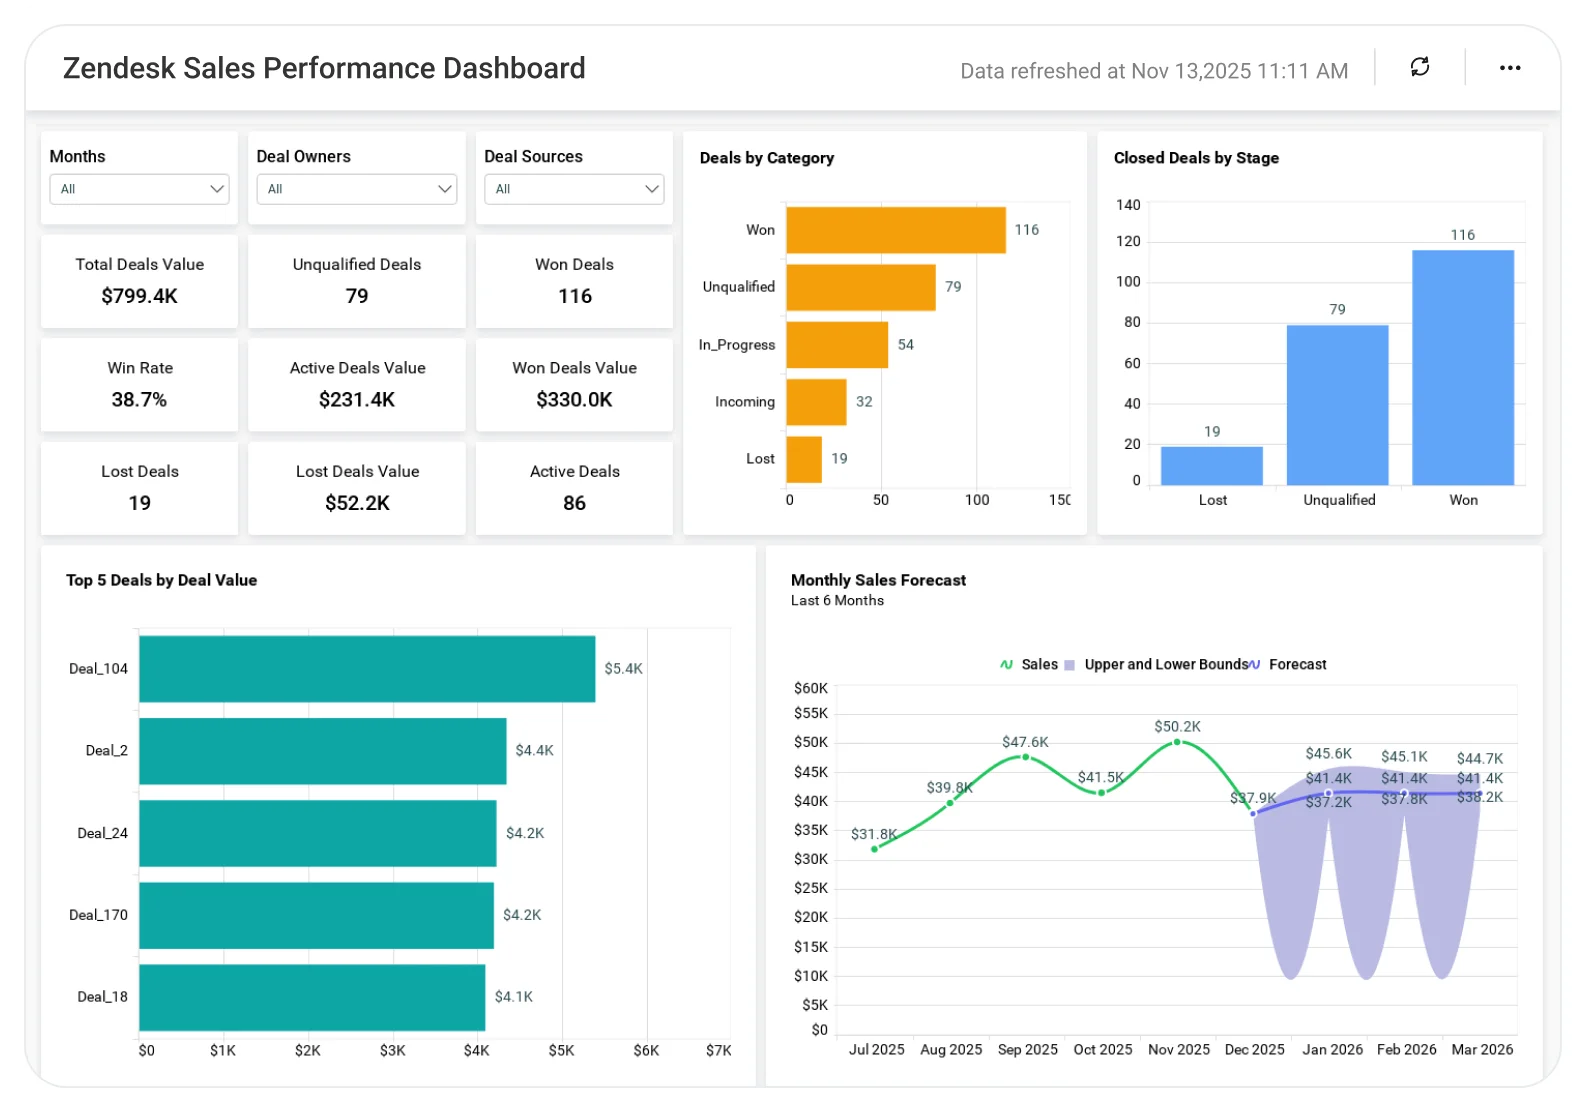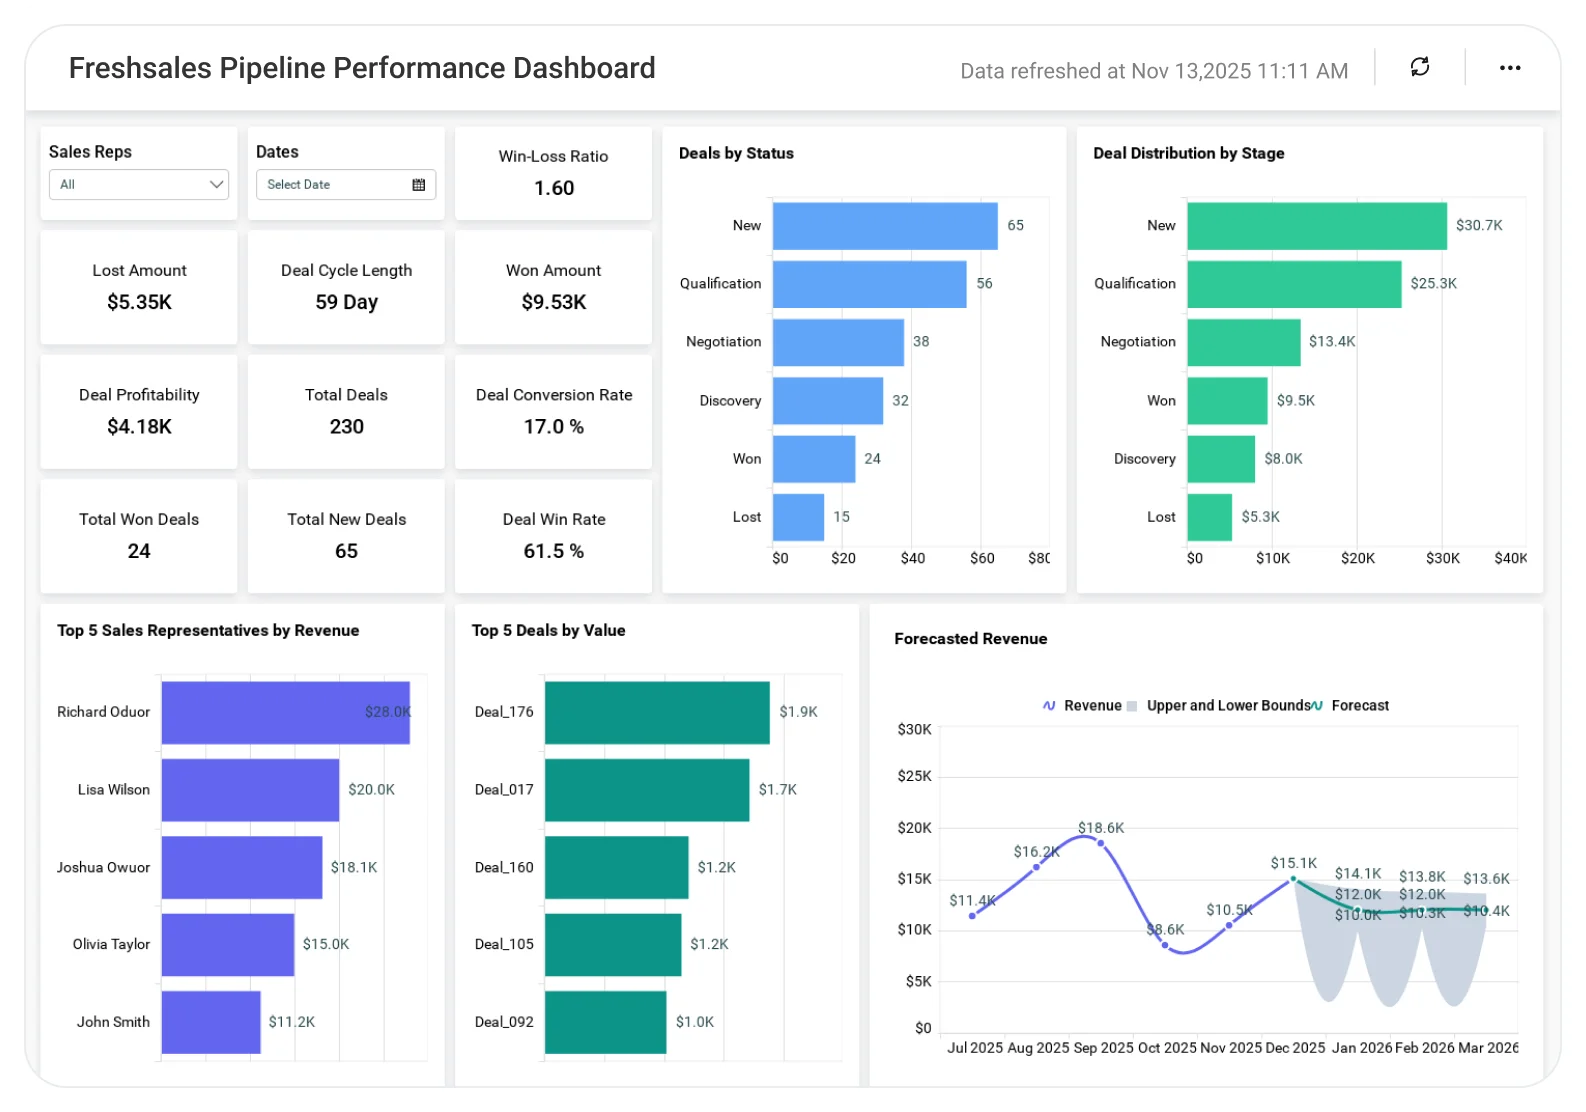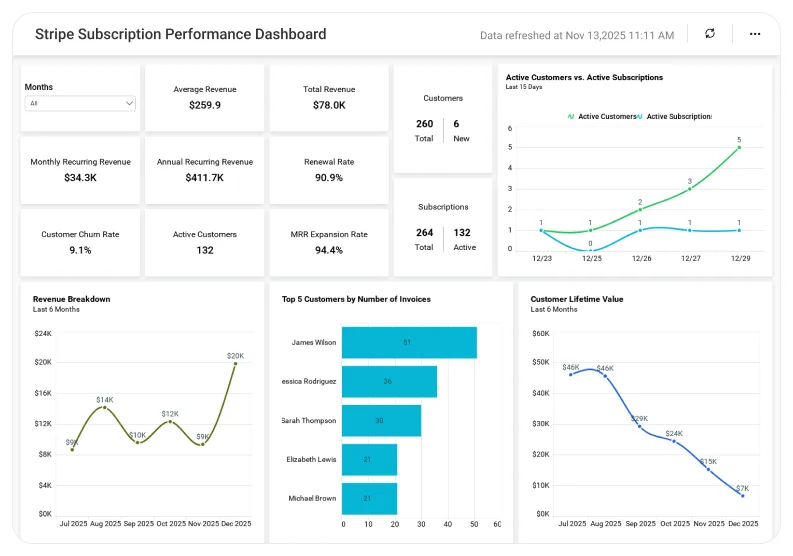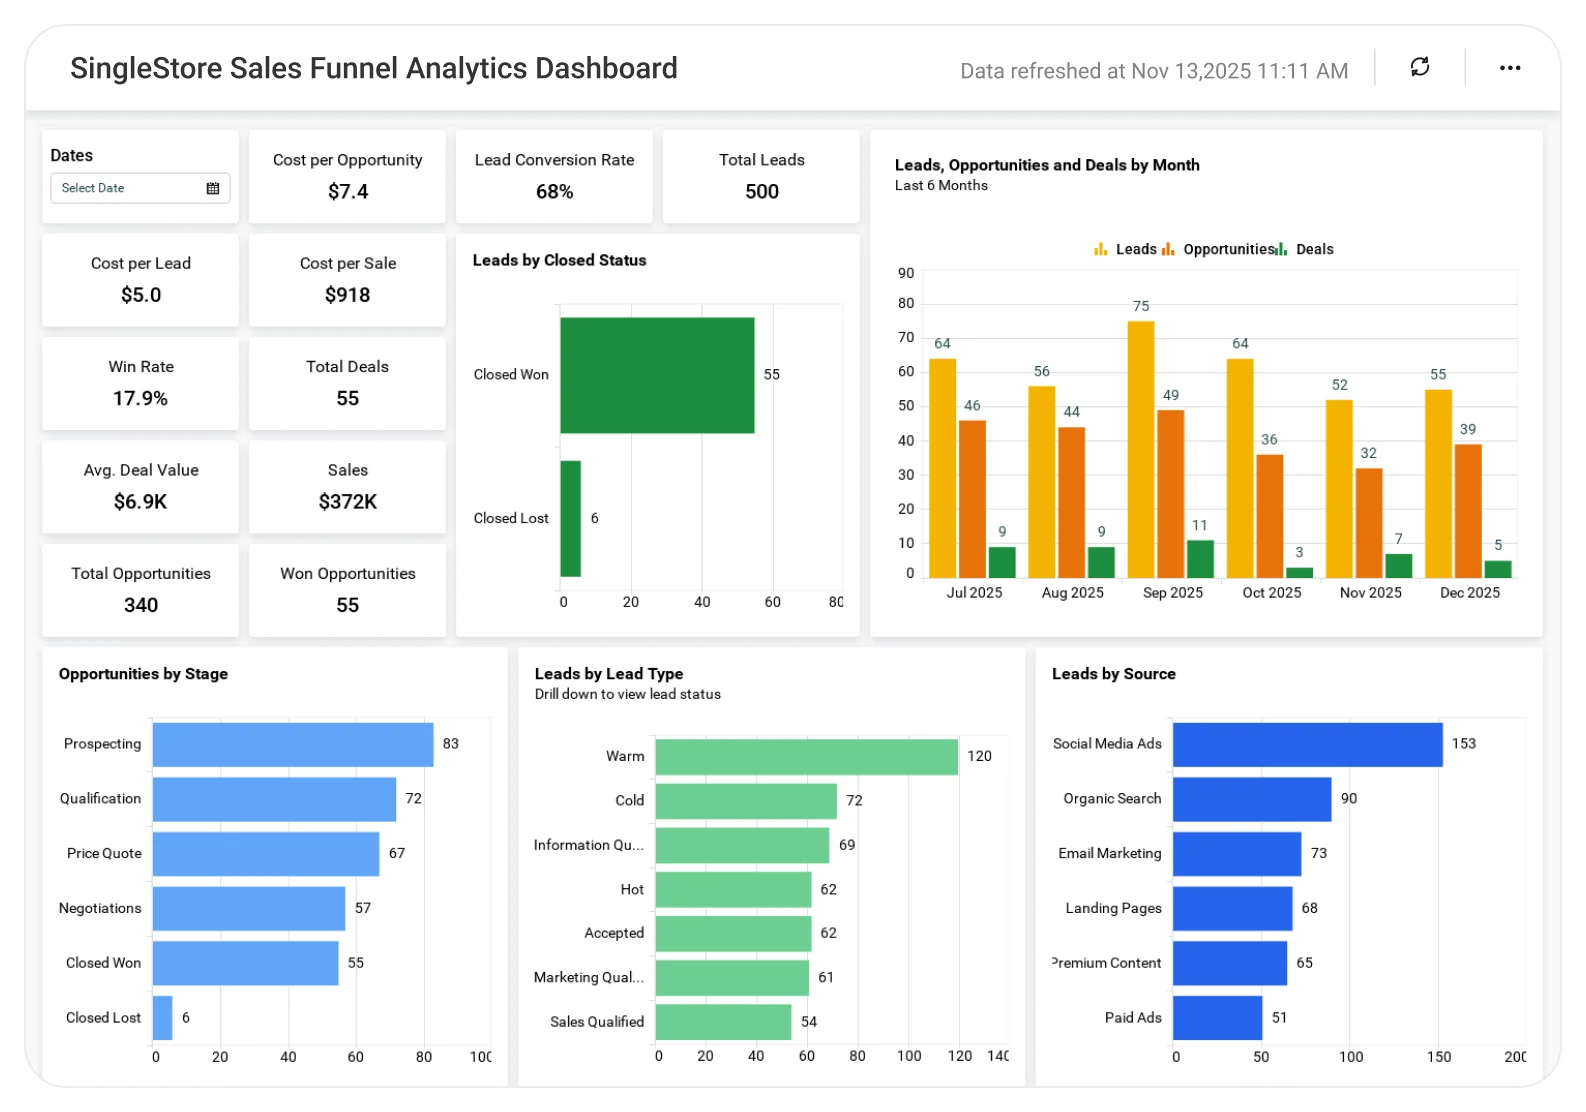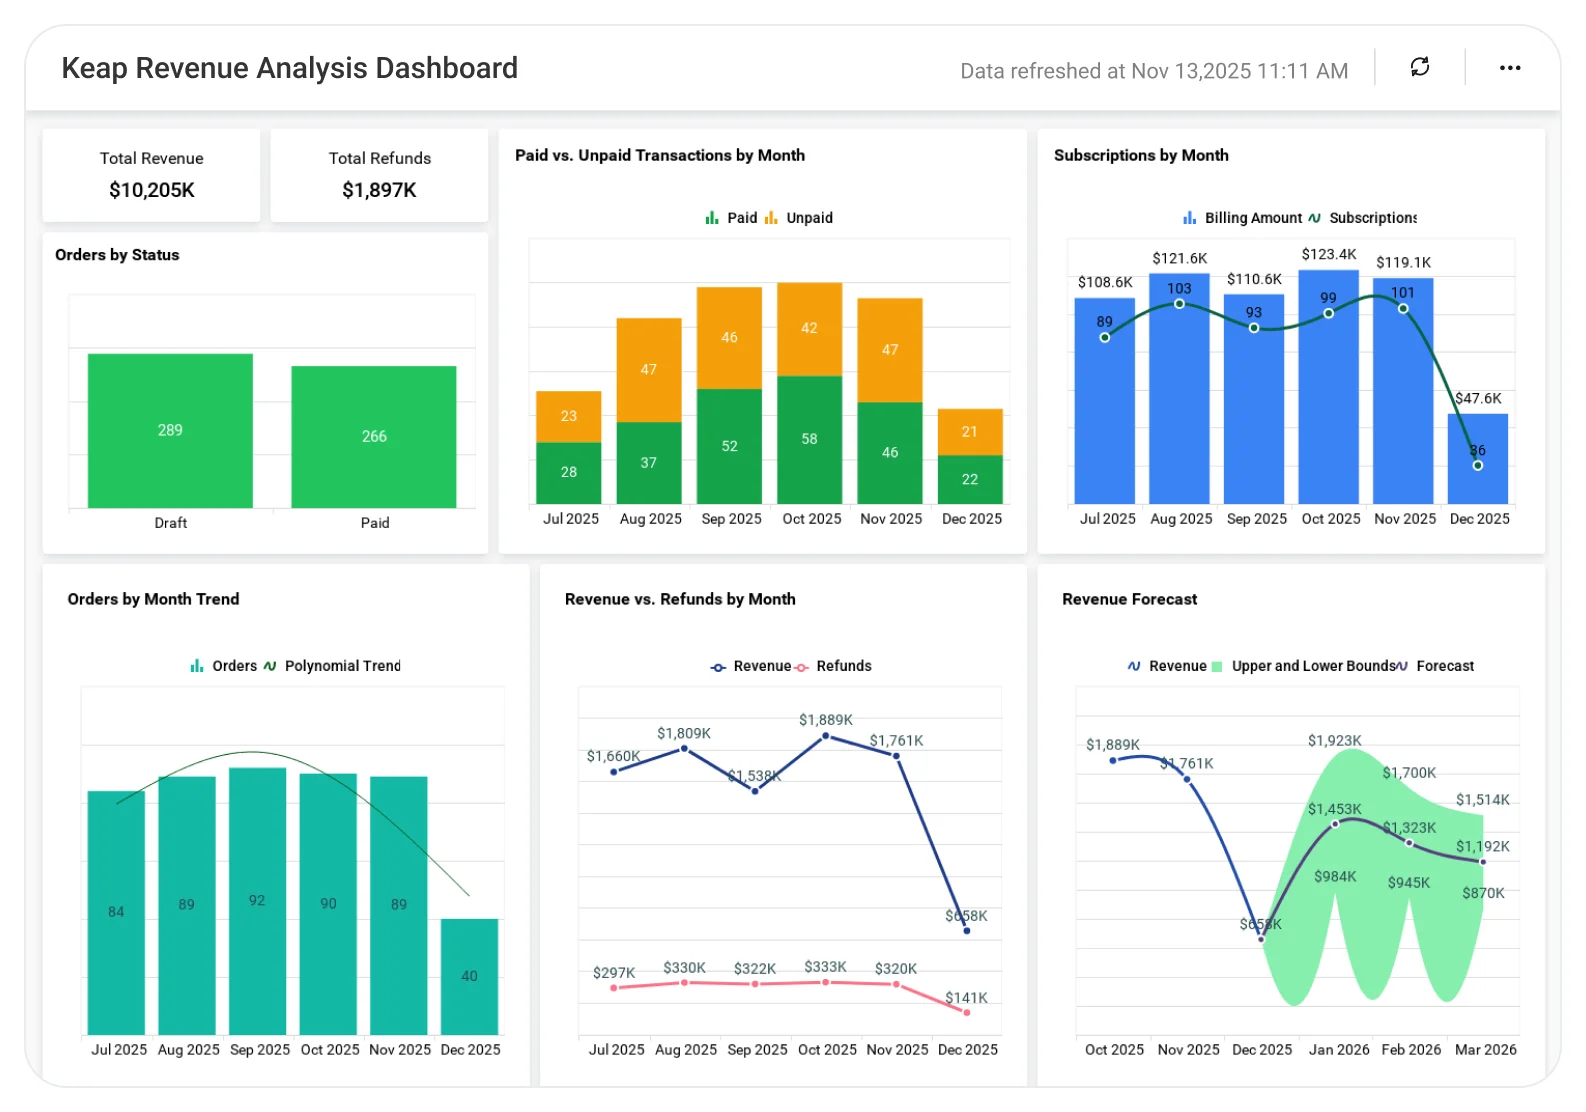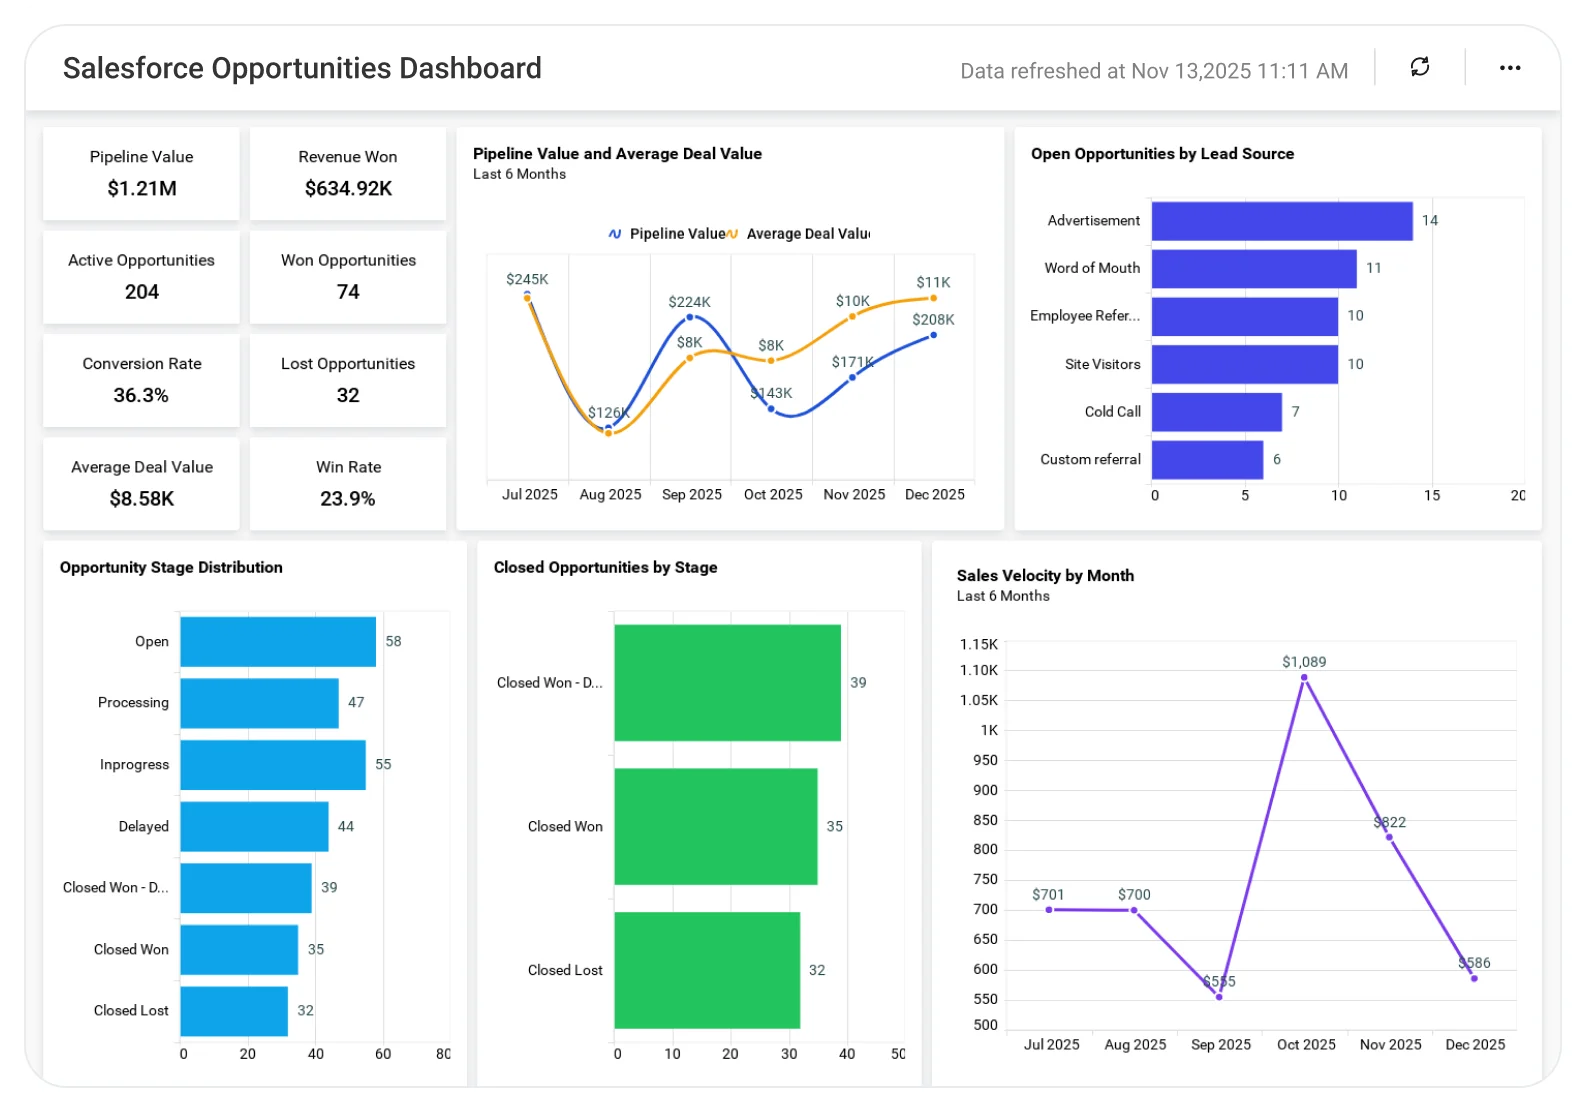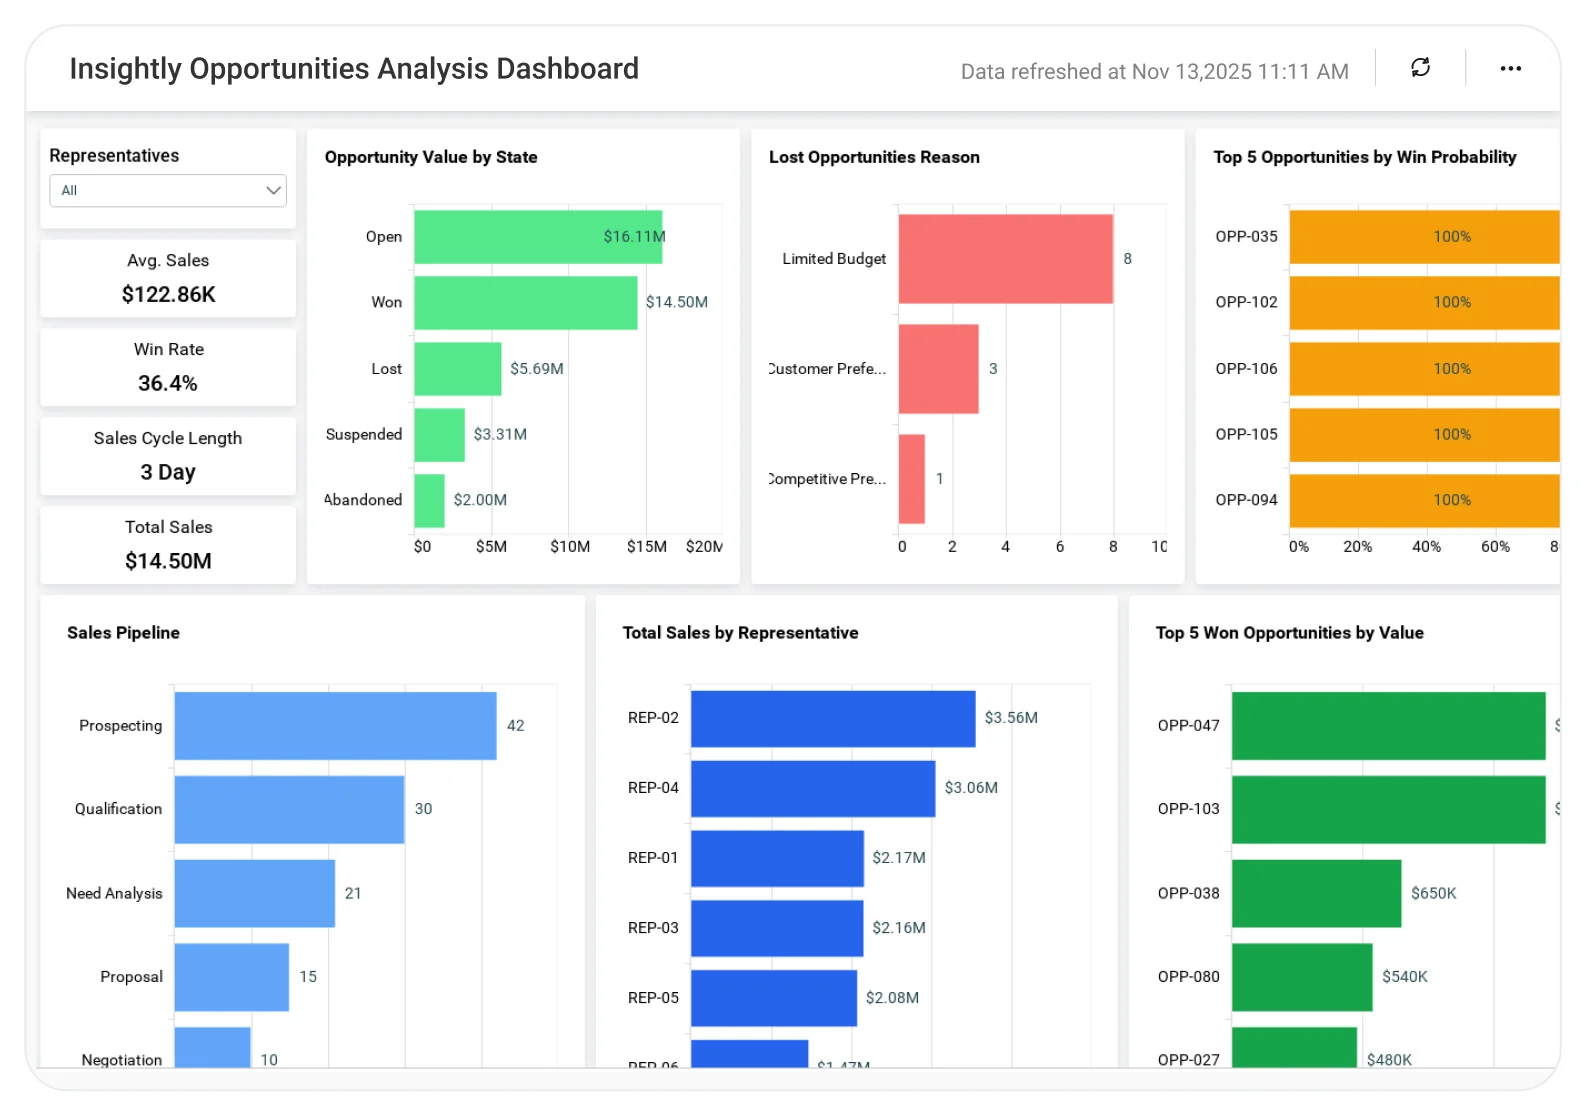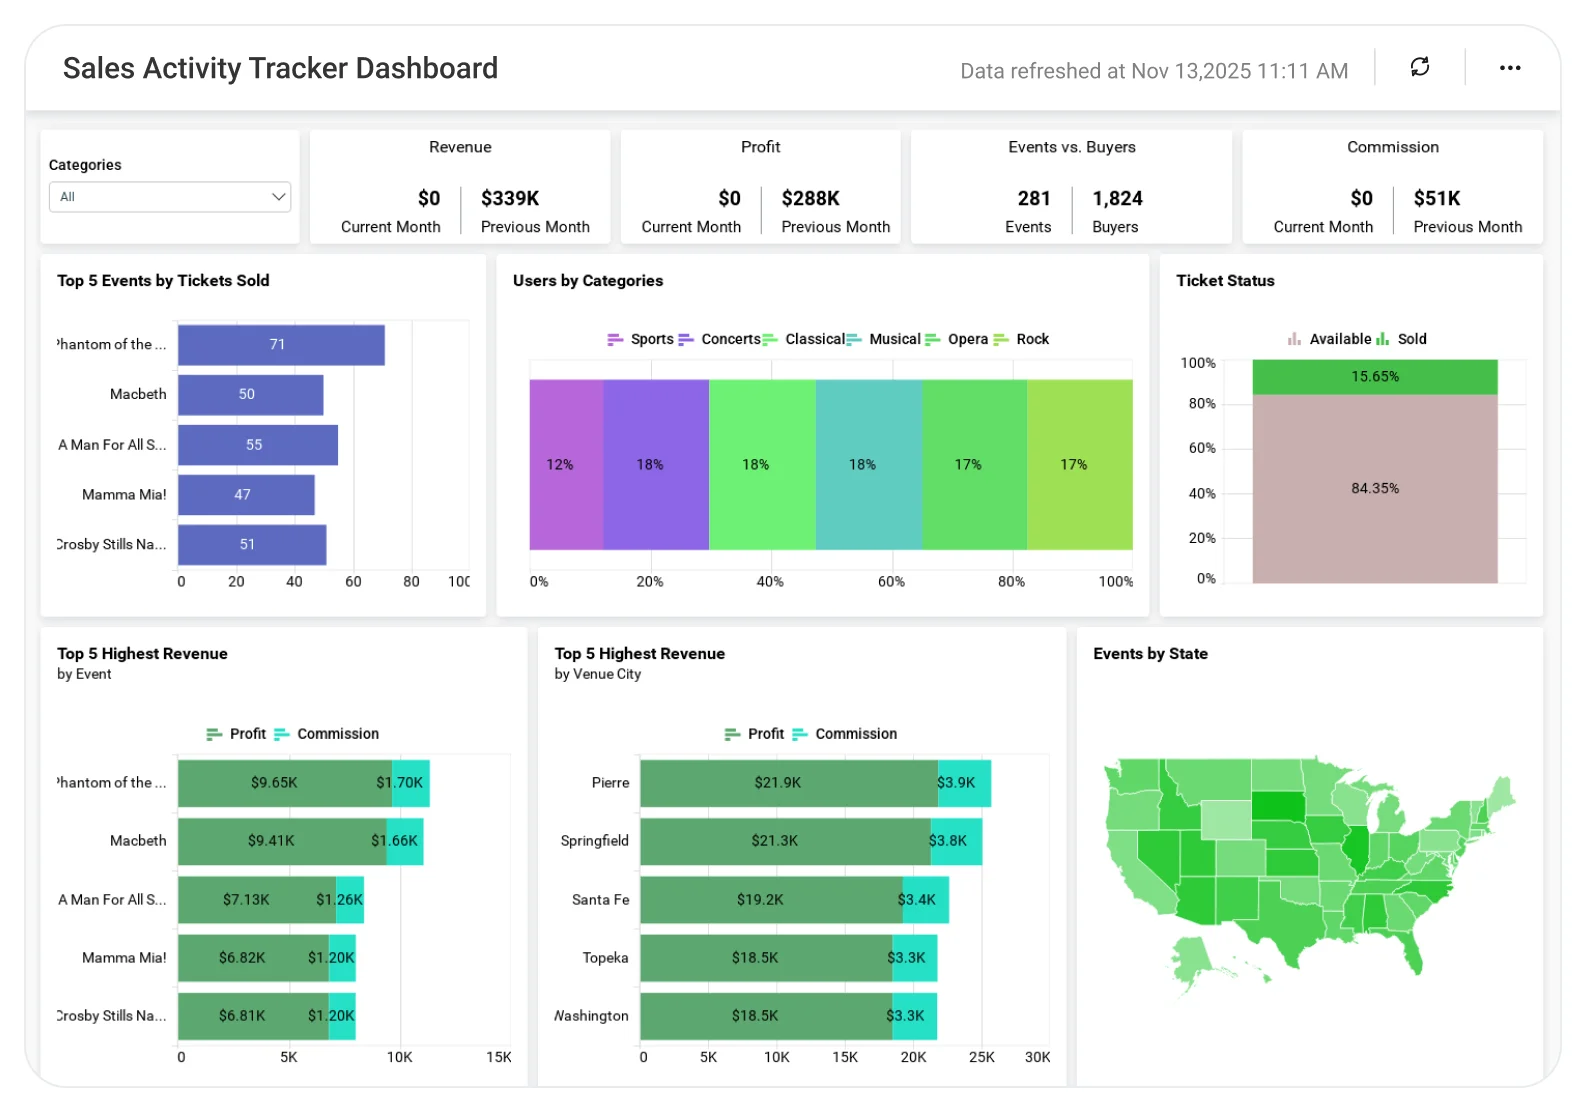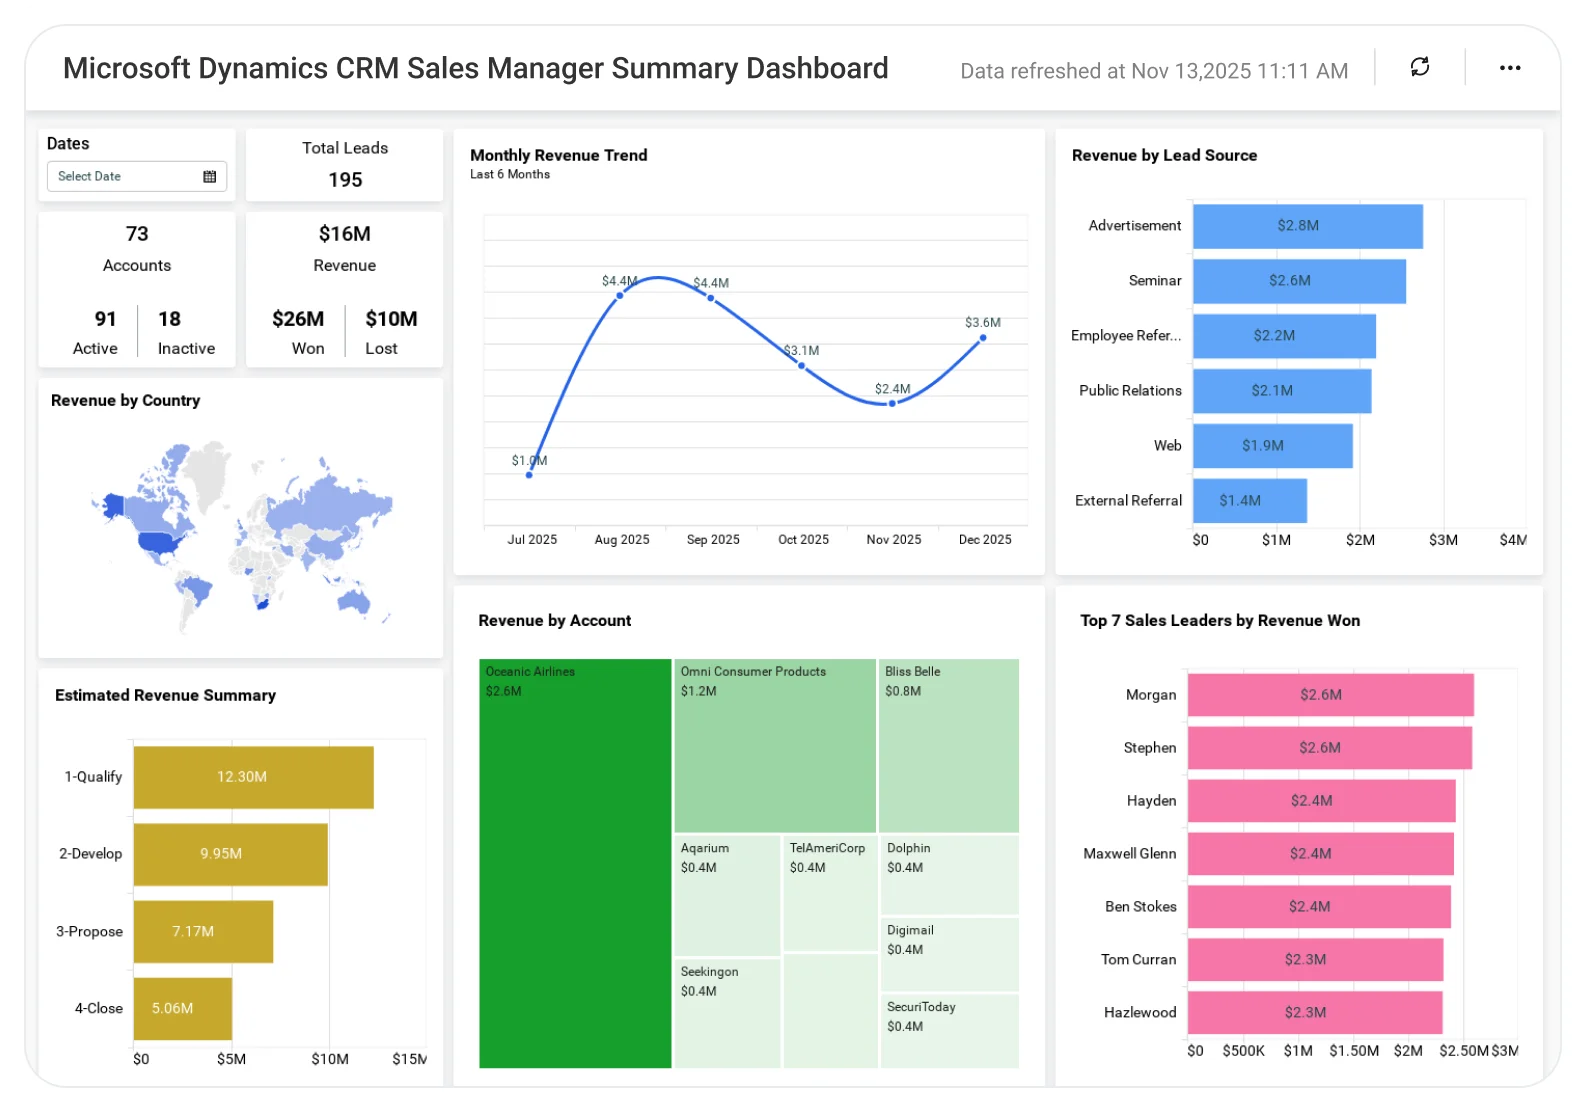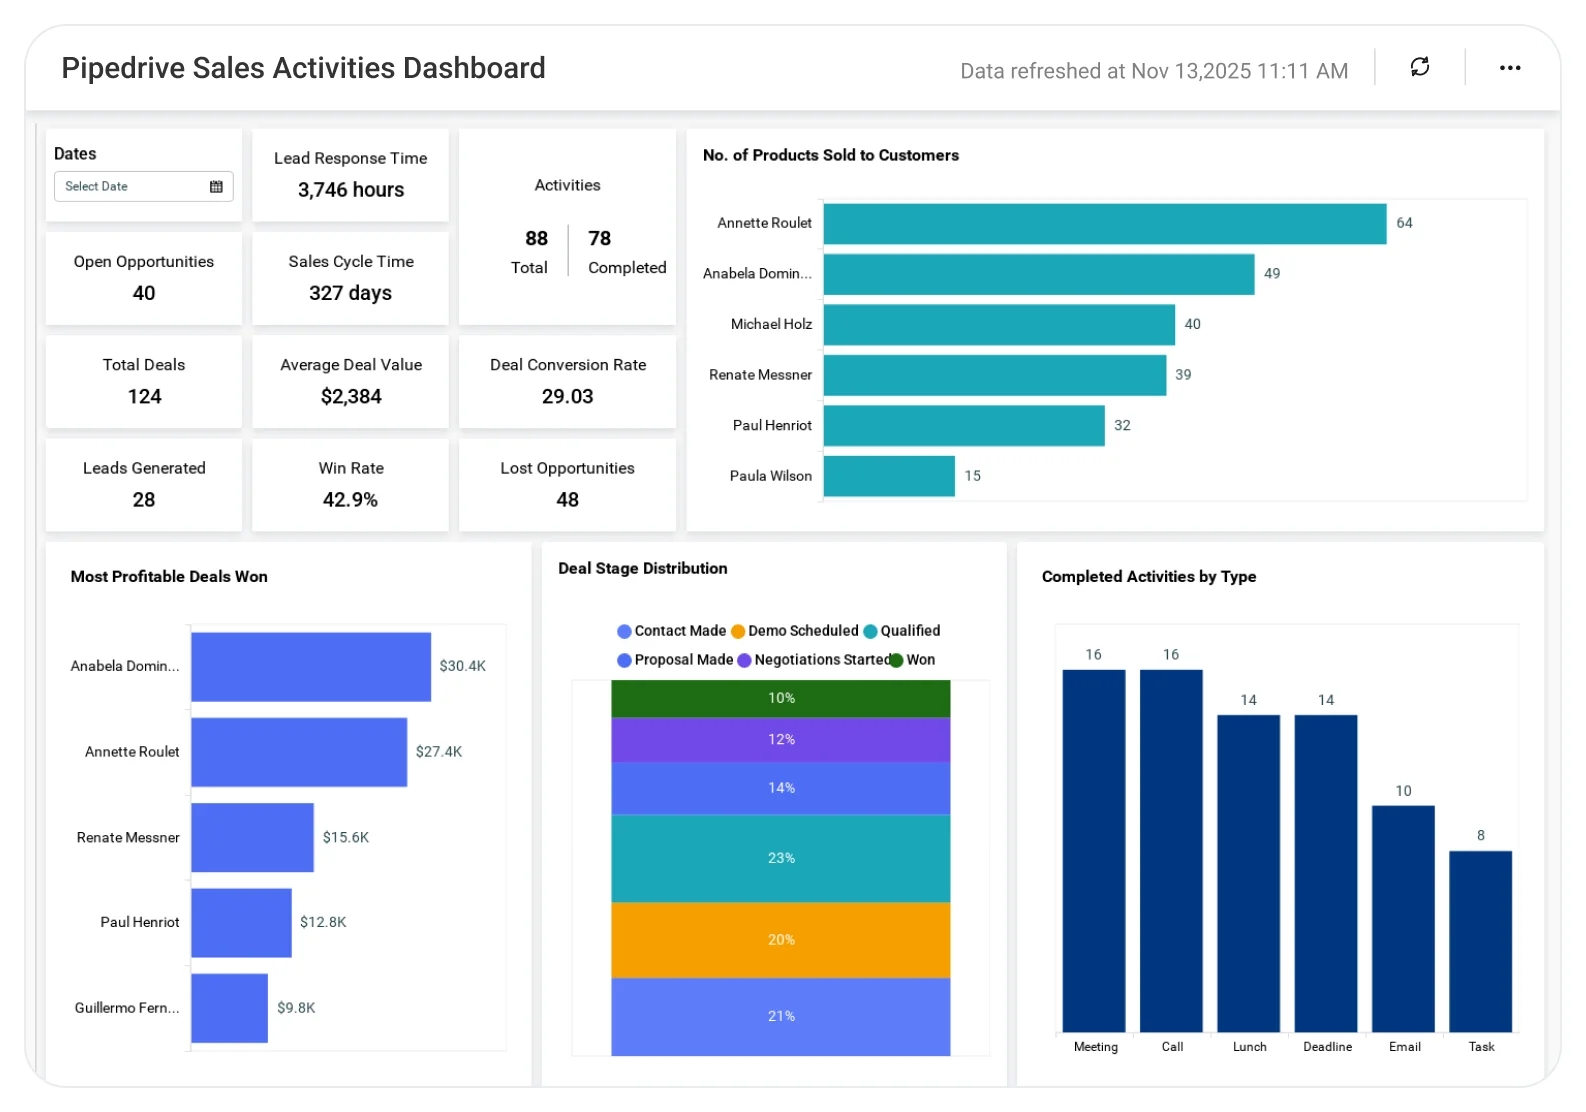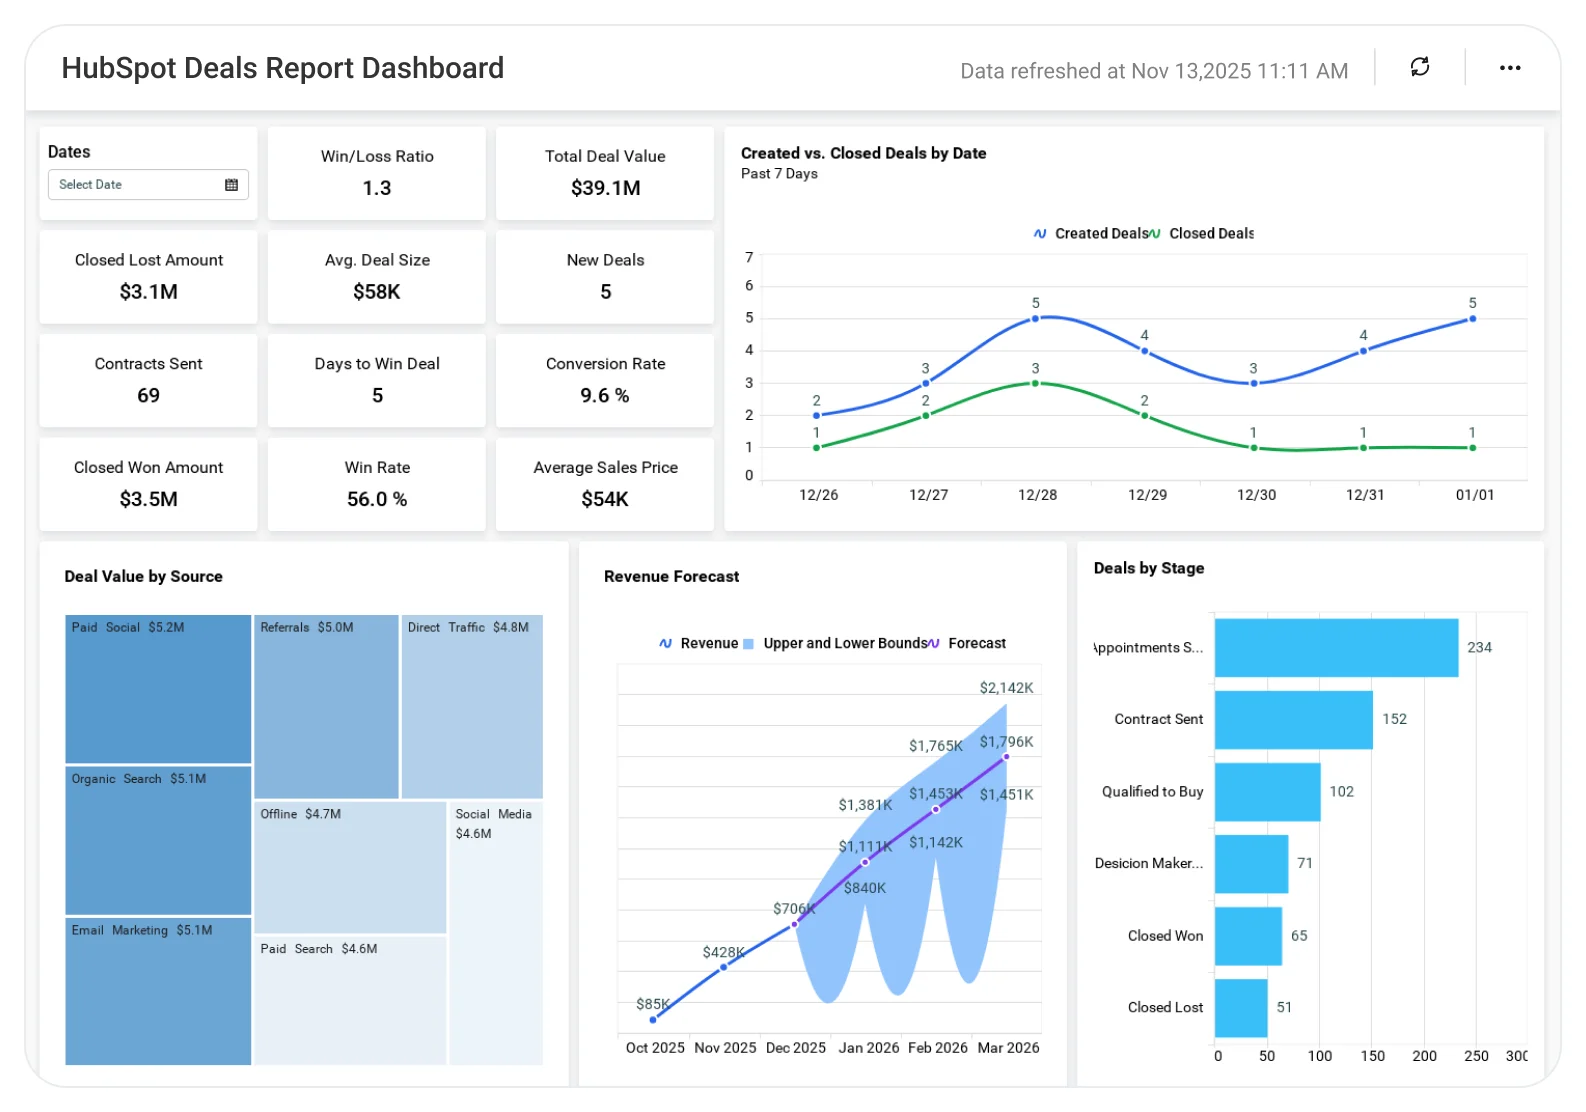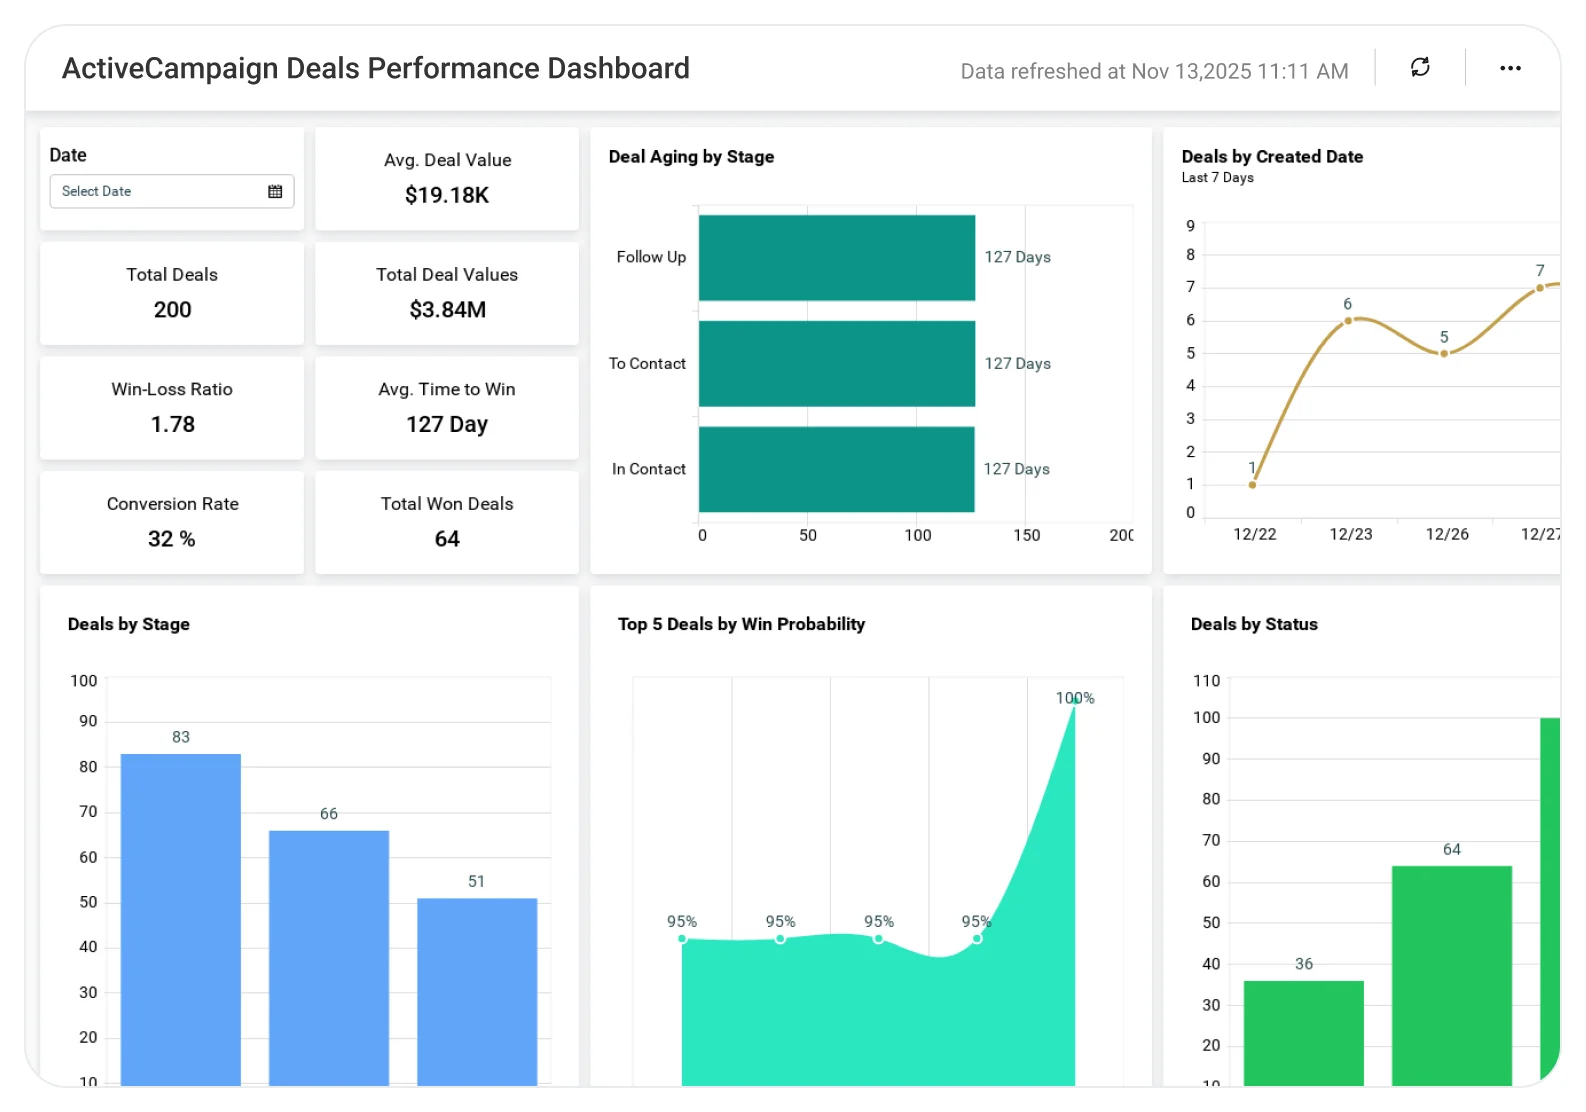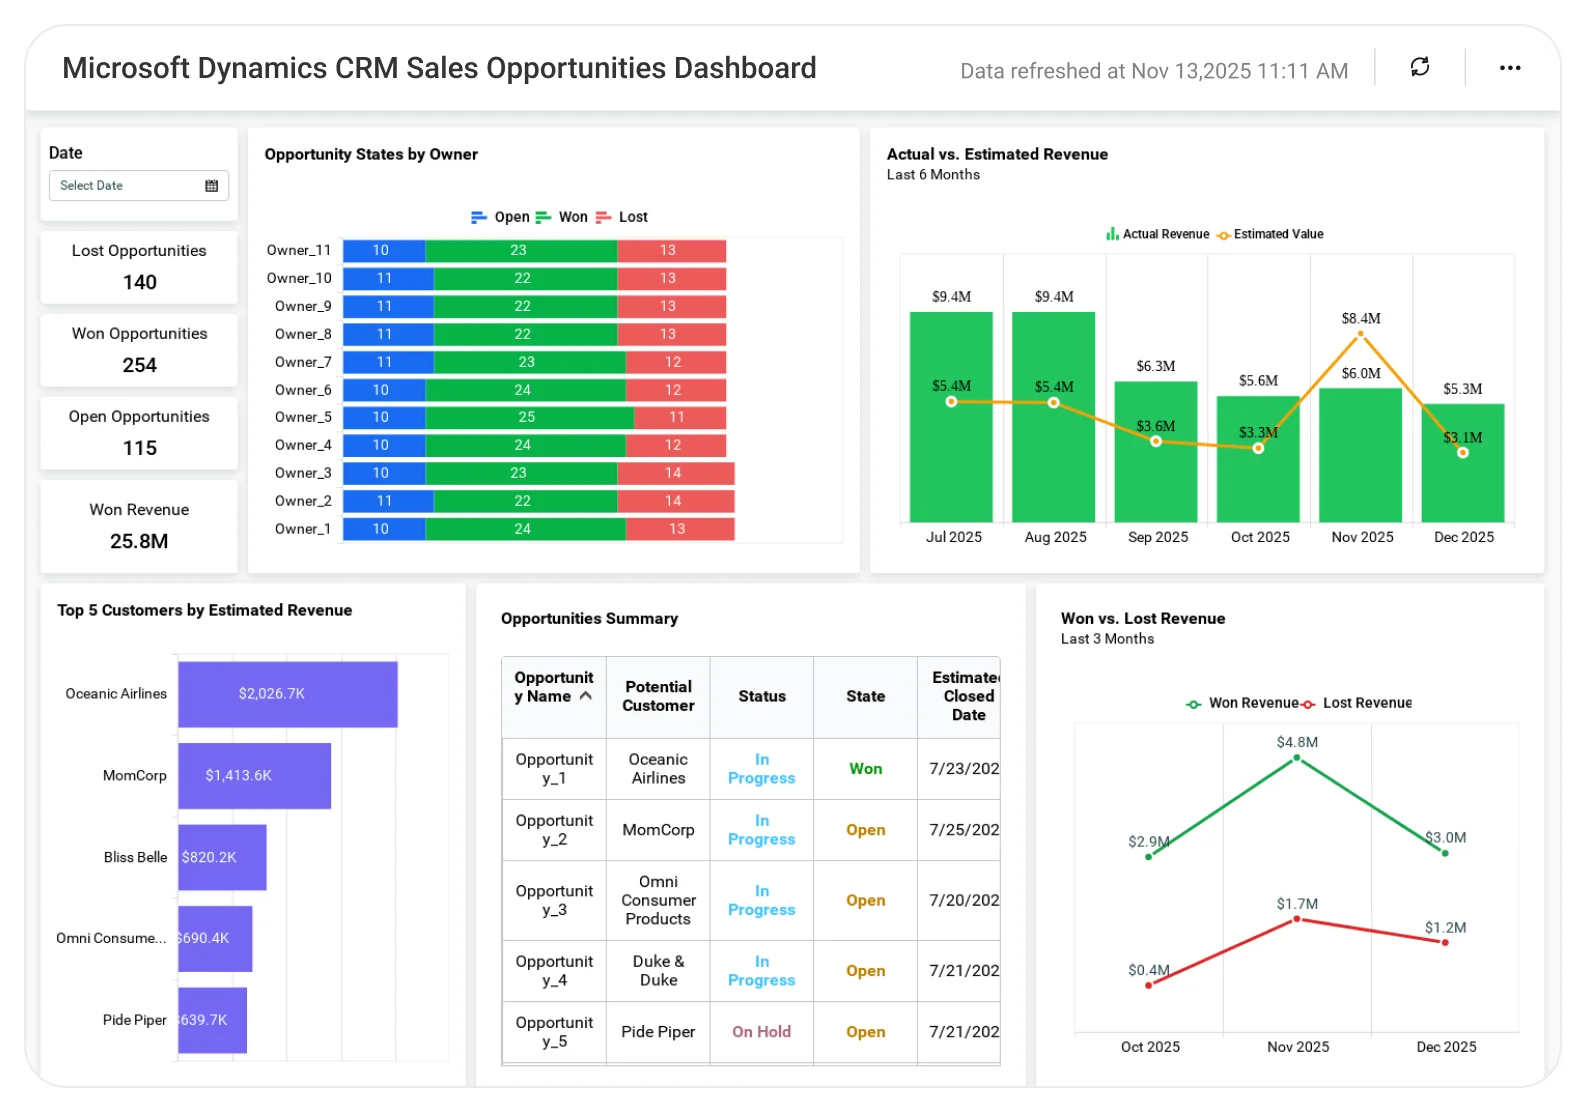
Sales Opportunities Dashboard
Identify and prioritize sales opportunities to improve conversions and revenue growth.
The Sales Opportunities Dashboard helps teams analyze opportunity stages, deal values, and pipeline progress, enabling better prioritization, focused selling, and higher win rates.
TL;DR
A single, executive-ready view of pipeline health, win rates, and revenue movement.
-
Won vs lost opportunities compared to last month.
-
Opportunities by stage and owner.
-
Top opportunities, accounts, and campaigns.
-
Revenue by campaign and by month.
-
Sales by country and geographic revenue insights.
-
Estimated vs actual revenue accuracy.
What Is a Sales Opportunities Dashboard?
A Sales Opportunities Dashboard is a visual analytics tool that tracks opportunity performance, pipeline stages, campaign impact, and revenue trends.
In Bold BI, it becomes an interactive, customizable dashboard that helps sales teams prioritize opportunities, improve forecasting accuracy, and drive consistent revenue growth.
Why Sales Opportunities Dashboard Matters
Opportunities are the bridge between pipeline activity and revenue.
Without a centralized view, sales leaders struggle to answer questions like:
-
Are we winning more opportunities than we’re losing?
-
Which stages or owners need attention?
-
Which campaigns generate the highest-value opportunities?
-
How accurate are our revenue forecasts?
The Sales Opportunities Dashboard answers these questions in one place, helping leaders guide teams toward predictable revenue growth.
What You’ll Track
-
Opportunity performance: Monitor won and lost opportunities and month-over-month changes.
-
Pipeline & ownership insights: Track opportunities by stage, owner, and rating.
-
Campaign-driven opportunities & revenue: Analyze opportunities, wins, and revenue by campaign, campaign type, and top-performing accounts.
-
Revenue trends & forecast accuracy: Compare won vs lost revenue by month and evaluate estimated vs actual revenue to assess forecasting reliability.
-
Time-based opportunity analysis: Review opportunities, revenue, and campaign impact by specific months or quarters to compare performance across periods and measure the impact of sales initiatives.
All dashboards are fully customizable, allowing you to add KPIs or metrics as needed.
How It Works
-
Connect CRM, opportunity, and campaign data.
-
Apply the Sales Opportunities Dashboard sample.
-
Blend opportunity, revenue, and campaign metrics.
-
Share dashboards securely with sales leaders and executives.
-
Act on insights to improve win rates and revenue predictability.
Why Bold BI Is the Right Fit for Sales Opportunities Analytics
-
Unified view of opportunities, campaigns, and revenue.
-
Interactive visuals with filters and drilldowns.
-
Executive-ready KPIs for fast reviews.
-
Enterprise-grade security with Single Sign On, Role Based Access Control and Row Level Security.
-
Embeddable dashboards for internal sales portals.
-
Cloud or self-hosted deployment options.
Compare Options (at a glance)
| Feature | Bold BI Sales Opportunities Dashboard | CRM Default Views | Spreadsheets |
| Pipeline & opportunity visibility | Yes | Limited | Manual |
| Deal stage & win/loss analysis | Yes | Limited | Manual |
| Sales performance trends | Yes | Limited | Manual |
| Interactive filtering & drilldowns | Yes | Limited | No |
| Shareable, executive-ready dashboards | Yes | Limited | No |
Frequently Asked Questions
More Articles About Sales Opportunities Dashboard
-
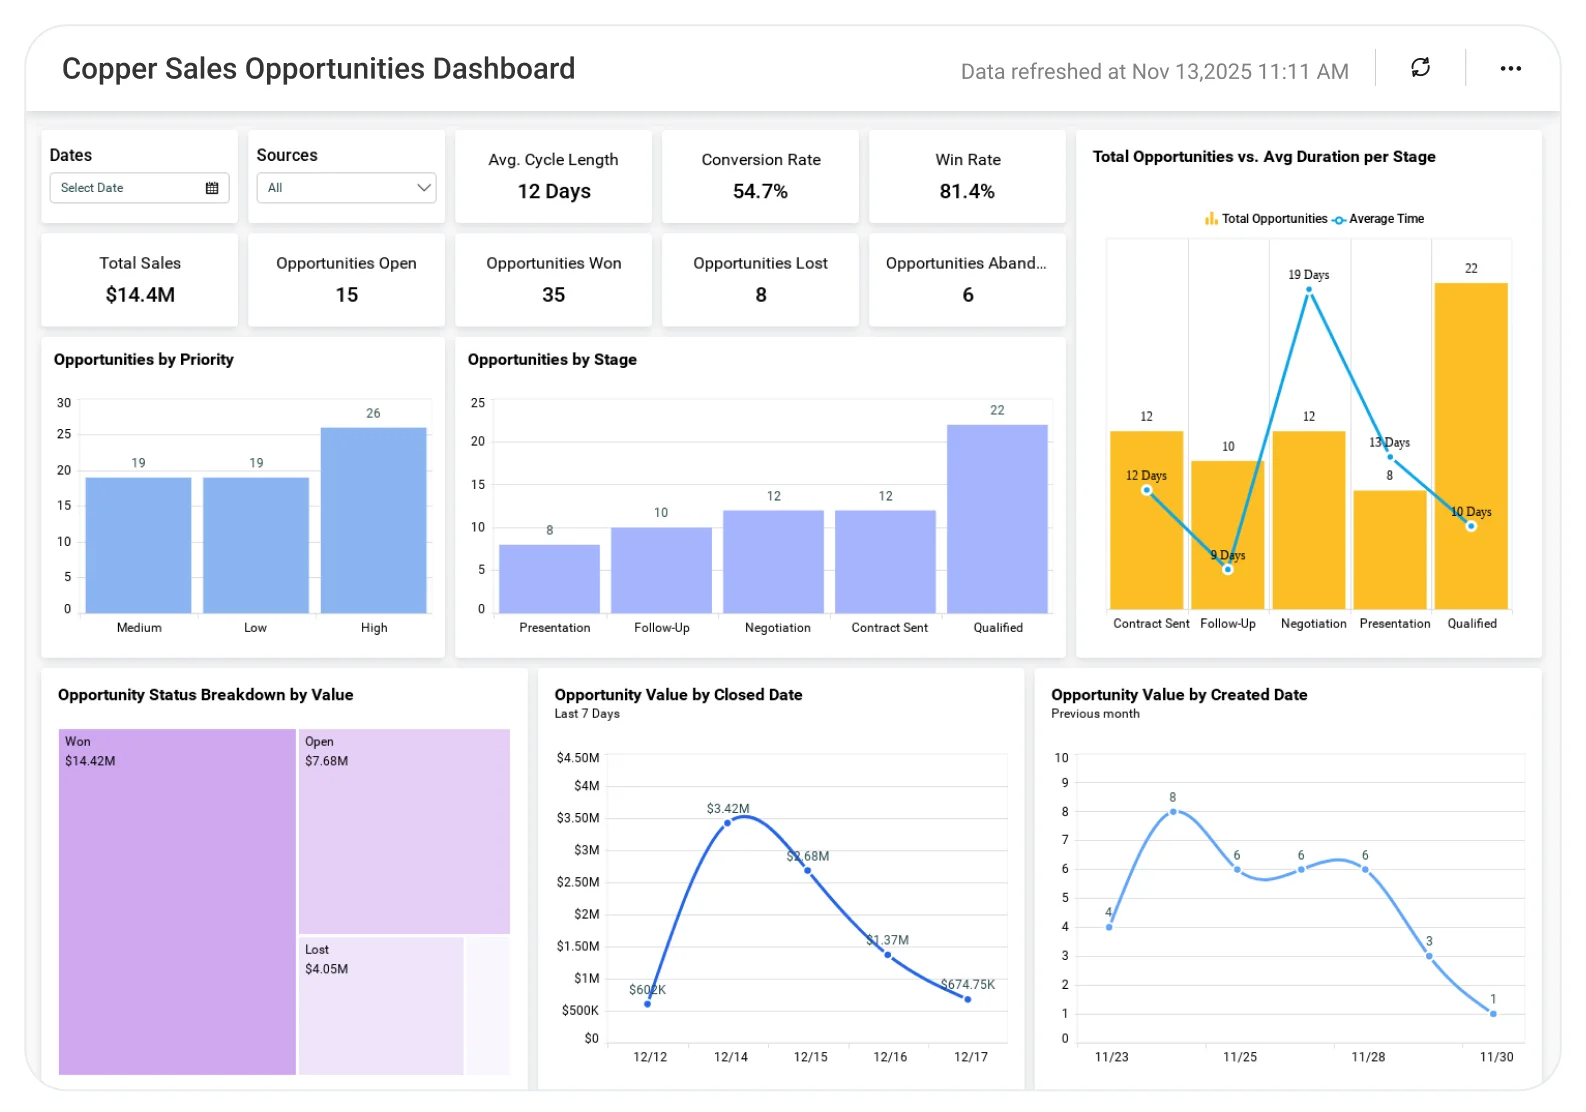
Copper Sales Opportunities Dashboard: 5 Key Metrics to Track
A blog post that details essential metrics for monitoring sales opportunities using a Copper CRM integration, including win rate, opportunity conversion rate, and pipeline visibility.
-
Drive Sales Growth Better with Salesforce Analytics
This article discusses using Bold BI to create opportunities dashboards with Salesforce data, covering metrics like expected revenue, won revenue, and lead sources.
-
Boost Your Sales with Embedded Analytics
This blog explains how embedding analytics can transform sales performance, detailing specific metrics for the sales opportunities dashboard, such as opportunity status by owner and rating.