

Freshsales Pipeline Performance Dashboard
Improve sales pipeline visibility, increase deal conversion, and support more predictable revenue outcomes through data‑driven CRM insights.
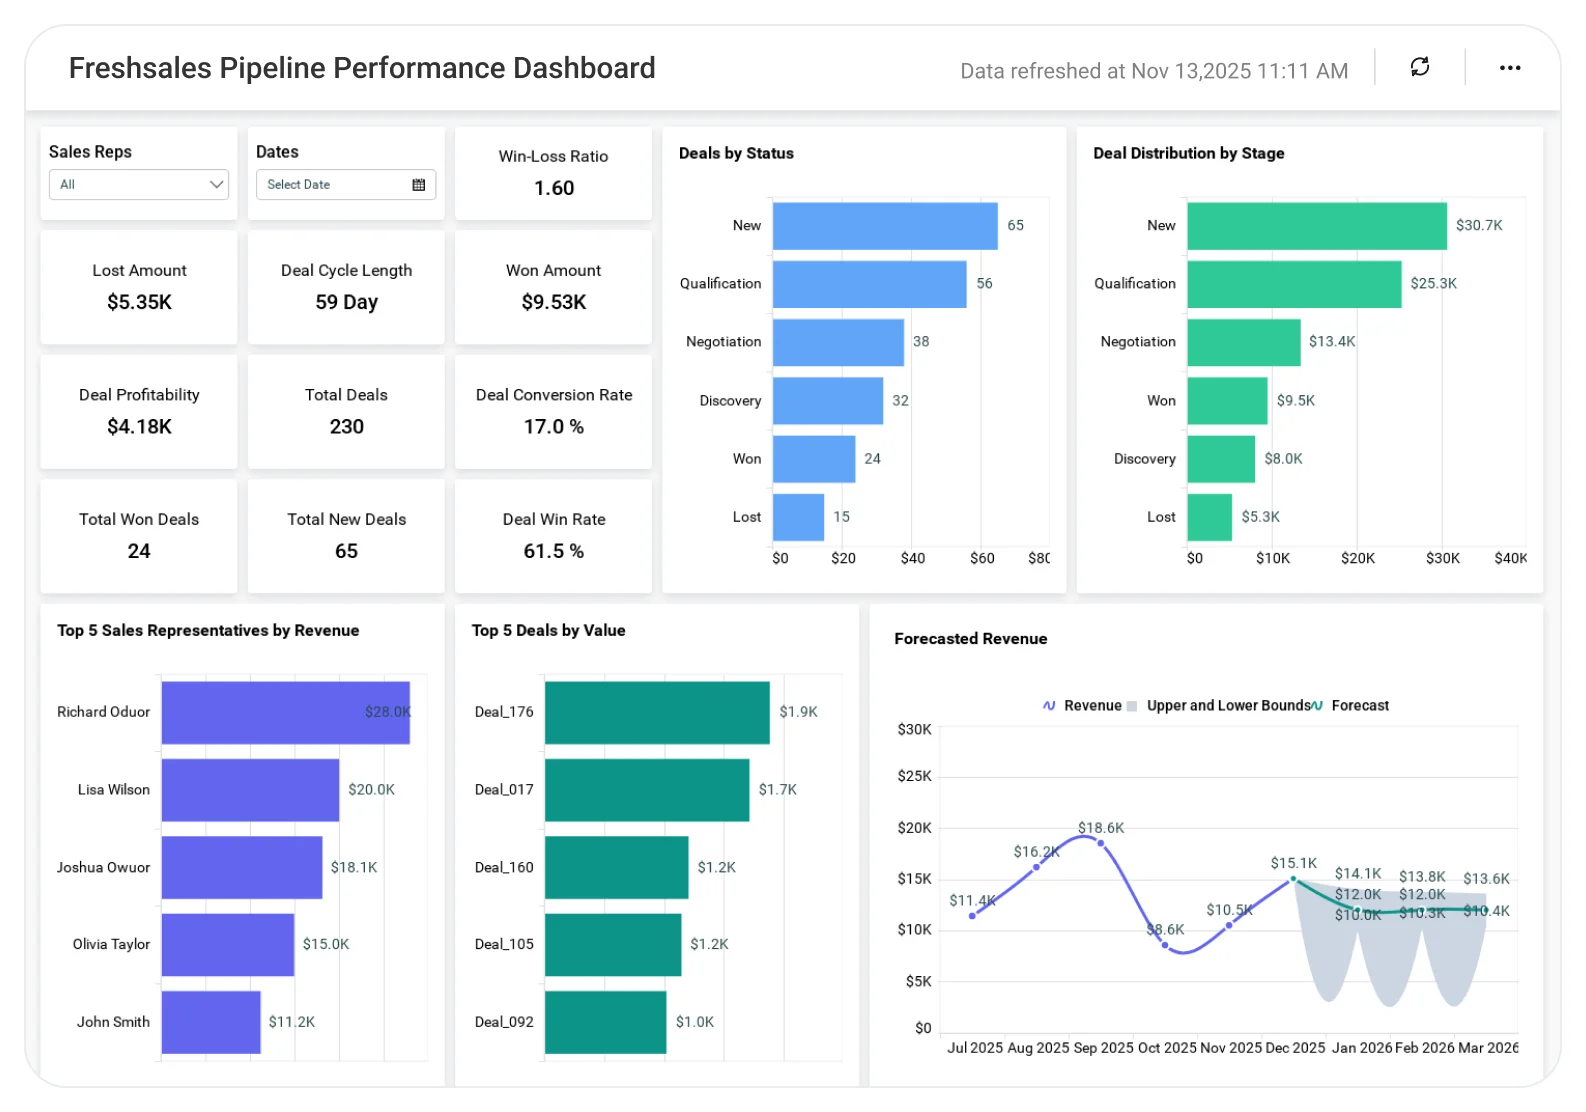
The Freshsales Pipeline Performance Dashboard helps sales and revenue teams track deal flow, pipeline health, and stage‑wise performance in one centralized view, supporting better forecasting and more focused sales execution.
TL;DR
-
Identify overall pipeline value and deal movement trends.
-
Track stage-wise conversions and deal velocity to identify pipeline bottlenecks early.
-
Spot stalled or slow-moving deals before they impact revenue forecasts.
-
Compare pipeline performance across sales reps, teams, or pipelines to focus coaching and execution.
-
Improve forecasting accuracy and deal conversion rates with data-driven CRM insights.
What Is a Freshsales Pipeline Performance Dashboard?
A Freshsales Pipeline Performance Dashboard is an analytics solution that helps sales teams understand how deals progress through the sales pipeline and where opportunities are won, delayed, or lost.
In Bold BI, this dashboard connects directly with Freshsales CRM data to consolidate pipeline stages, deal values, and ownership, supporting informed decisions around forecasting, prioritization, and overall sales strategy.
Why Freshsales Pipeline Performance Dashboard Matters
A healthy pipeline is essential for predictable revenue and efficient sales execution.
When pipeline data is reviewed only through CRM views:
-
Bottlenecks remain hidden.
-
Stalled deals are hard to identify early.
-
Forecast accuracy suffers.
-
Sales focus becomes reactive.
A centralized analytics dashboard enables teams to move from static pipeline snapshots to insight-driven pipeline optimization.
What You’ll Track
Using Bold BI dashboards, you will track important KPIs such as:
-
Pipeline value distribution: Total deal value by stage to understand revenue potential and concentration.
-
Stage-wise conversion rates: Deal movement and drop-off rates across pipeline stages to identify bottlenecks.
-
Deal velocity metrics: Time spent at each stage to spot stalled or slow-moving opportunities.
-
Sales owner performance: Pipeline contribution and conversion performance by sales rep or team.
All dashboards are fully customizable, allowing you to add KPIs or metrics as needed.
How It Works
-
Connect your Freshsales data to Bold BI.
-
Apply the Freshsales Pipeline Performance Dashboard sample.
-
Combine deal, pipeline, and ownership data in one unified view.
-
Analyze insights by stage, owner, pipeline, or time period.
-
Share dashboards with sales managers and leadership teams.
Why Bold BI Is the Right Fit for Freshsales Pipeline Performance Analytics
-
Unified pipeline visibility: Bring Freshsales deal and pipeline data into a single analytics dashboard.
-
Centralized performance analysis: Evaluate pipeline health, velocity, and conversions together.
-
Comparative insights: Compare pipelines, sales reps, or periods to identify strengths and gaps.
-
Actionable drilldowns: Investigate stalled deals, stage drop-offs, or performance variations in detail.
-
Flexible deployment: Deploy dashboards securely in cloud or self-hosted environmentsto track pipeline performance.
Compare Options (at a glance)
| Feature | Bold BI | Freshsales CRM Views | Spreadsheets |
| Pipeline performance analytics | Yes | Limited | Manual |
| Stage-wise conversion insights | Yes | Partial | Manual |
| Deal velocity analysis | Yes | Limited | Manual |
| Rep-level performance views | Yes | Limited | Manual |
| Custom KPIs & drilldowns | Fully customizable | Fixed | Manual |


