

Insightly Opportunities Analysis Dashboard
Analyze sales opportunities to improve win rates and forecast revenue more accurately.
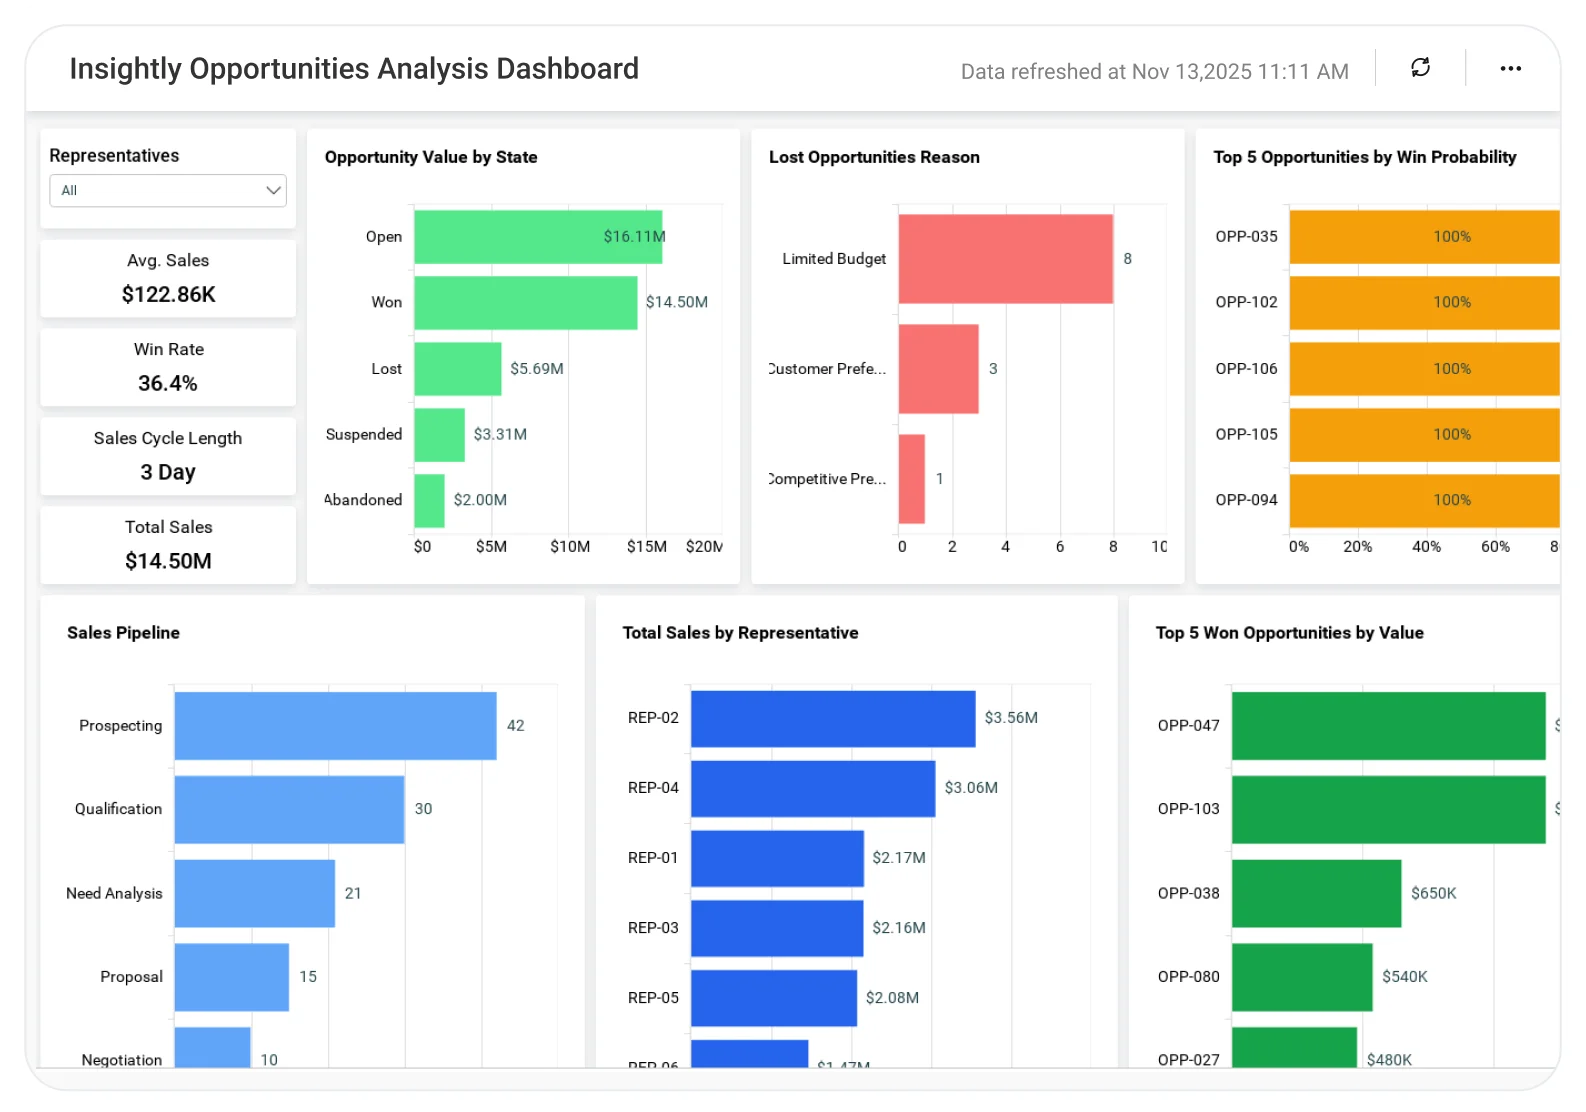
The Insightly Opportunities Analysis Dashboard helps sales teams evaluate opportunity stages, deal values, conversion trends, and pipeline health, enabling better prioritization, stronger follow-ups, and predictable revenue growth.
TL;DR
-
Pipeline visibility: You’ll be able to track total sales, average deal size, and win rate.
-
Performance insights: Find out which reps are closing the biggest deals.
-
Stage analysis: See how opportunities are spread across each stage of your pipeline.
-
Loss prevention: Dig into why deals were lost and take steps to fix the issues.
-
Revenue forecasting: Track potential and unrealized revenue by opportunity state.
What Is an Insightly Opportunities Analysis Dashboard?
An Insightly Opportunities Analysis Dashboard shows where each opportunity stands, how much it’s worth, and how it’s progressing.
With Bold BI, teams use simple visuals and filters to monitor performance, improve win rates, and understand whether their current sales strategy is working.
Why Insightly Opportunities Analysis Dashboard Matters
This dashboard brings all key Insightly CRM opportunity data into a single, easy-to-understand view. So, through this dashboard, sales managers will be able to provide answers to these questions:
-
What are the team's total sales and average sale value?
-
What is the win-rate of the sales team?
-
Who among the sales reps has made the most significant sales?
-
How many opportunities are there in the different statuses of the sales pipeline in terms of percentage?
What You'll Track
-
Total sales & deal value: Monitor total sales and average deal size to understand revenue performance.
-
Sales cycle efficiency: Track sales cycle length to see how quickly opportunities move from open to close.
-
Win rate performance: Measure win rates to evaluate how effectively opportunities are converted.
-
Opportunity pipeline health: Track opportunity stages, states, and progression across the pipeline.
-
Rep & segment performance: Compare results by sales rep, region, or segment using interactive filters.
-
Revenue potential insights: Identify high-value opportunities and areas to improve deal size and close speed.
How It Works
-
Apply sample: Pick the Insightly Opportunities Analysis Dashboard.
-
Blend: Combine CRM, marketing, and finance data for a complete view.
-
Share: Give tailored views to execs, managers, and reps.
-
Set alerts: Get notified when the pipeline dips or goals fall short.
Why Bold BI Is the Right Fit for Insightly Opportunities Analytics
-
Unified analytics beyond CRM: Combine CRM, finance, and marketing data in one dashboard instead of relying on native CRM reports alone.
-
Interactive drilldowns: Move quickly from high-level pipeline views to individual opportunities with just a few clicks.
-
Actionable revenue insights: Spot revenue opportunities, stalled deals, and leakage early to improve close rates.
-
Secure & governed sharing: Ensure compliant access with Single Sign On(SSO) and detailed audit logs.
-
Embedded & accessible: Embed live dashboards directly into your CRM or intranet so insights are always available where teams work.
Compare Options (at a glance)
| Feature | Bold BI | Insightly Built-in Reports | Spreadsheets |
|---|---|---|---|
| Opportunity pipeline & stage tracking | Yes | Limited | Manual |
| Forecast value & close date analysis | Yes | Partial | Manual |
| Win rate, loss reasons & conversion metrics | Yes | Limited | Manual |
| Drilldowns by owner, team, region, and product/service | Yes | Limited | Manual |
| Custom KPIs & dashboards | Fully customizable | Fixed | Manual |
Frequently Asked Questions
More Articles About Insightly Opportunities Analysis Dashboard
-
Unlocking Sales Success: Using Sales Funnel Analysis
 Discover how funnel analysis reveals drop-offs and boosts conversions, complementing Insightly dashboard insights for better sales.
-
Visualizing Sales Success with Bar Graphs
Learn how bar charts simplify sales comparisons by product, region, or rep, enhancing Insightly dashboard performance tracking.


