

Sales Leads Tracking Dashboard for Sales Managers
Understand lead quality and pipeline progress to improve sales conversions.
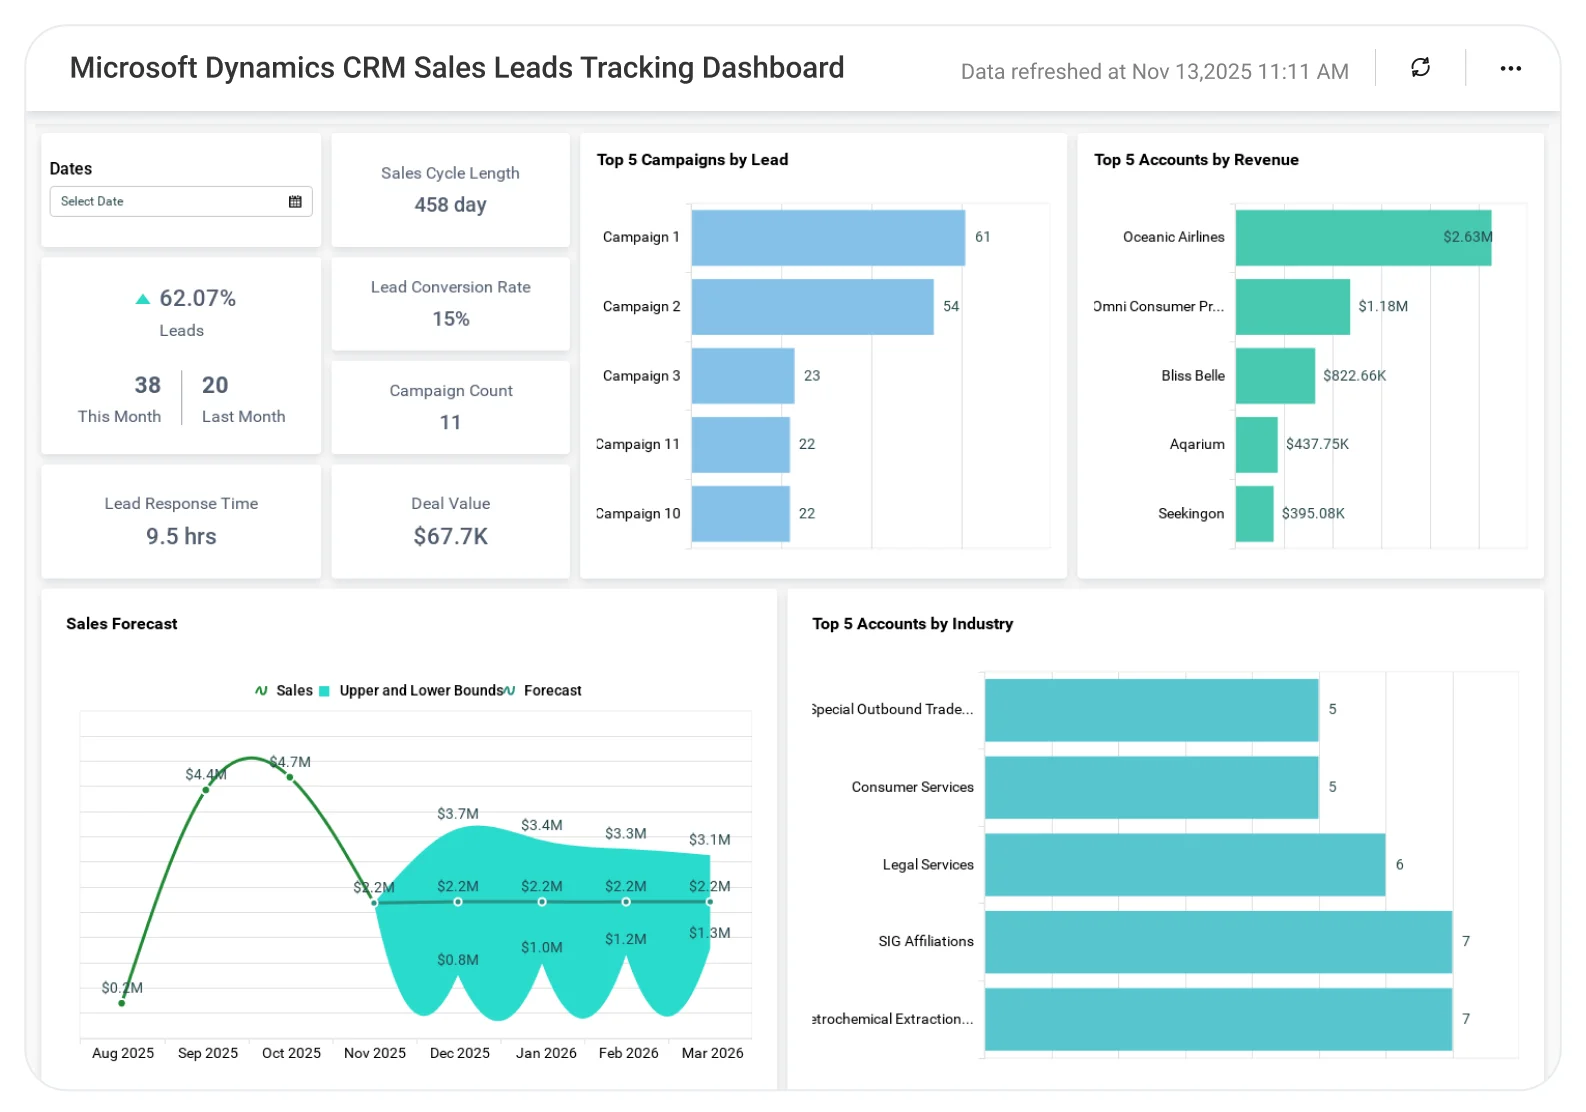
The Sales Leads Tracking Dashboard helps teams analyze lead sources, lead stages, and conversion trends, enabling better prioritization, faster follow-ups, and more effective sales outcomes.
TL;DR
-
Lead generation insights: Compare new leads and accounts month over month to understand growth trends.
-
Campaign analysis: Identify which campaigns and sources consistently deliver high-quality leads.
-
Account performance: Break down accounts by revenue, country, and industry to uncover opportunities.
-
Conversion tracking: Monitor lead ratings and generation rates across your funnel.
-
Flexible filters: Focus on specific time periods, campaigns, or trends that matter most.
What Is a Sales Leads Tracking Dashboard?
It’s a real-time view of lead performance, campaign impact, and account growth. In Bold BI, that means live data connections, interactive filters, and charts that show how your marketing efforts translate into sales results.
Why Sales Leads Tracking Dashboard Matters
This dashboard gives you a clear breakdown of your company’s leads and accounts. With it, you can answer questions like:
-
How many accounts and leads do we have compared to last month?
-
How do our leads break down by campaign and rating?
-
How do accounts compare by revenue, country, and industry?
-
What’s our lead generation rate and where are those leads coming from?
What You'll Track
-
Total leads & accounts: Track current lead and account counts and compare them with previous periods to understand growth trends.
-
Lead source performance: Analyze which campaigns, owners, ratings, and channels generate the highest-quality leads.
-
Lead generation trends: Monitor how many new leads are created over time to evaluate marketing and sales momentum.
-
Account performance insights: Assess revenue contribution, country-wise distribution, and industry mix across accounts.
-
Pipeline & lead status details: Drill into individual leads using the Leads Summary view to see account name, creation date, owner, and current pipeline stage.
-
Time-based filtering: Focus analysis on specific date ranges to review campaigns, lead flow, and performance for chosen periods.
-
Customizable metrics: Add or adjust KPIs and visuals to align with your sales goals.
How It Works
-
Connect: Plug in Excel, or SQL sources (Salesforce, Insightly, HubSpot).
-
Apply sample: Start with the Sales Leads Tracking Dashboard sample.
-
Blend: Combine marketing and sales data for a complete picture.
-
Share: Give role-based access to team members and executives.
-
Act: Adjust campaigns based on real-time lead performance.
Why Bold BI Is the Right Fit for Sales Leads Tracking Analytics
-
Unified sales visibility: Combine CRM, marketing, and sales pipeline data into a single, always-updated dashboard, with no spreadsheets or fragmented reports.
-
Live, actionable insights: Monitor lead flow and lead quality in real time to identify slow points and focus on high-value opportunities.
-
Flexible analysis & sharing: Create custom KPIs and visuals, and share dashboards easily with sales teams and executives.
-
Secure access: Keep sales data protected with Single Sign On and controlled access.
Compare Options (at a glance)
| Feature | Bold BI | CRM Lead Reports | Spreadsheets |
|---|---|---|---|
| Lead volume & source tracking (by channel/campaign) | Yes | Limited | Manual |
| Lead qualification funnel (new → contacted → qualified → converted) | Yes | Partial | Manual |
| Conversion rates (lead-to-opportunity, lead-to-customer) | Yes | Limited | Manual |
| Lead response & follow-up SLAs (time-to-first-touch, overdue leads) | Yes | Partial | Manual |
| Rep performance on leads (speed, touchpoints, outcomes) | Yes | Limited | Manual |
| Data blending across systems (CRM + ads + web forms) | Yes | Limited | Manual |
| Custom KPIs & dashboards | Fully customizable | Fixed | Manual |
Frequently Asked Questions
Absolutely. Apply filters, add KPIs, and tweak visuals to match your sales structure.
Basic setup can be completed in a few hours using existing data sources and the dashboard sample. More advanced customization depends on data complexity and reporting requirements.
Yes. Bold BI includes encryption, SSO, RBAC, and row-level security to keep your data protected and shareable with the right people.
Yes. The dashboard refreshes automatically as new lead and activity data is added, giving your sales team up-to-date visibility at all times.
Bold BI connects to popular CRMs, databases, spreadsheets, and APIs, allowing you to track leads, activities, and conversions from multiple systems in one dashboard.
Yes. Bold BI supports secure, token-based embedding so your team can access dashboards right inside their workflow.
More Articles About Sales Leads Tracking Dashboard
-
Visualize Sales Metrics with Zoho CRM Dashboard
 Shows how to integrate Zoho CRM with Bold BI for tracking leads, deals, and revenue.
Includes KPIs like lead distribution by country and pipeline stages.
Shows how to integrate Zoho CRM with Bold BI for tracking leads, deals, and revenue.
Includes KPIs like lead distribution by country and pipeline stages.
-
Getting Insights from Dynamics 365 Sales data
Explains how to connect Dynamics 365 Sales data to Bold BI dashboards.
Covers creating a Sales Manager Summary dashboard and visualizing leads and opportunities.


