

Ticket Sales Analysis Dashboard
Understand ticket sales performance to optimize pricing, demand, and revenue outcomes.
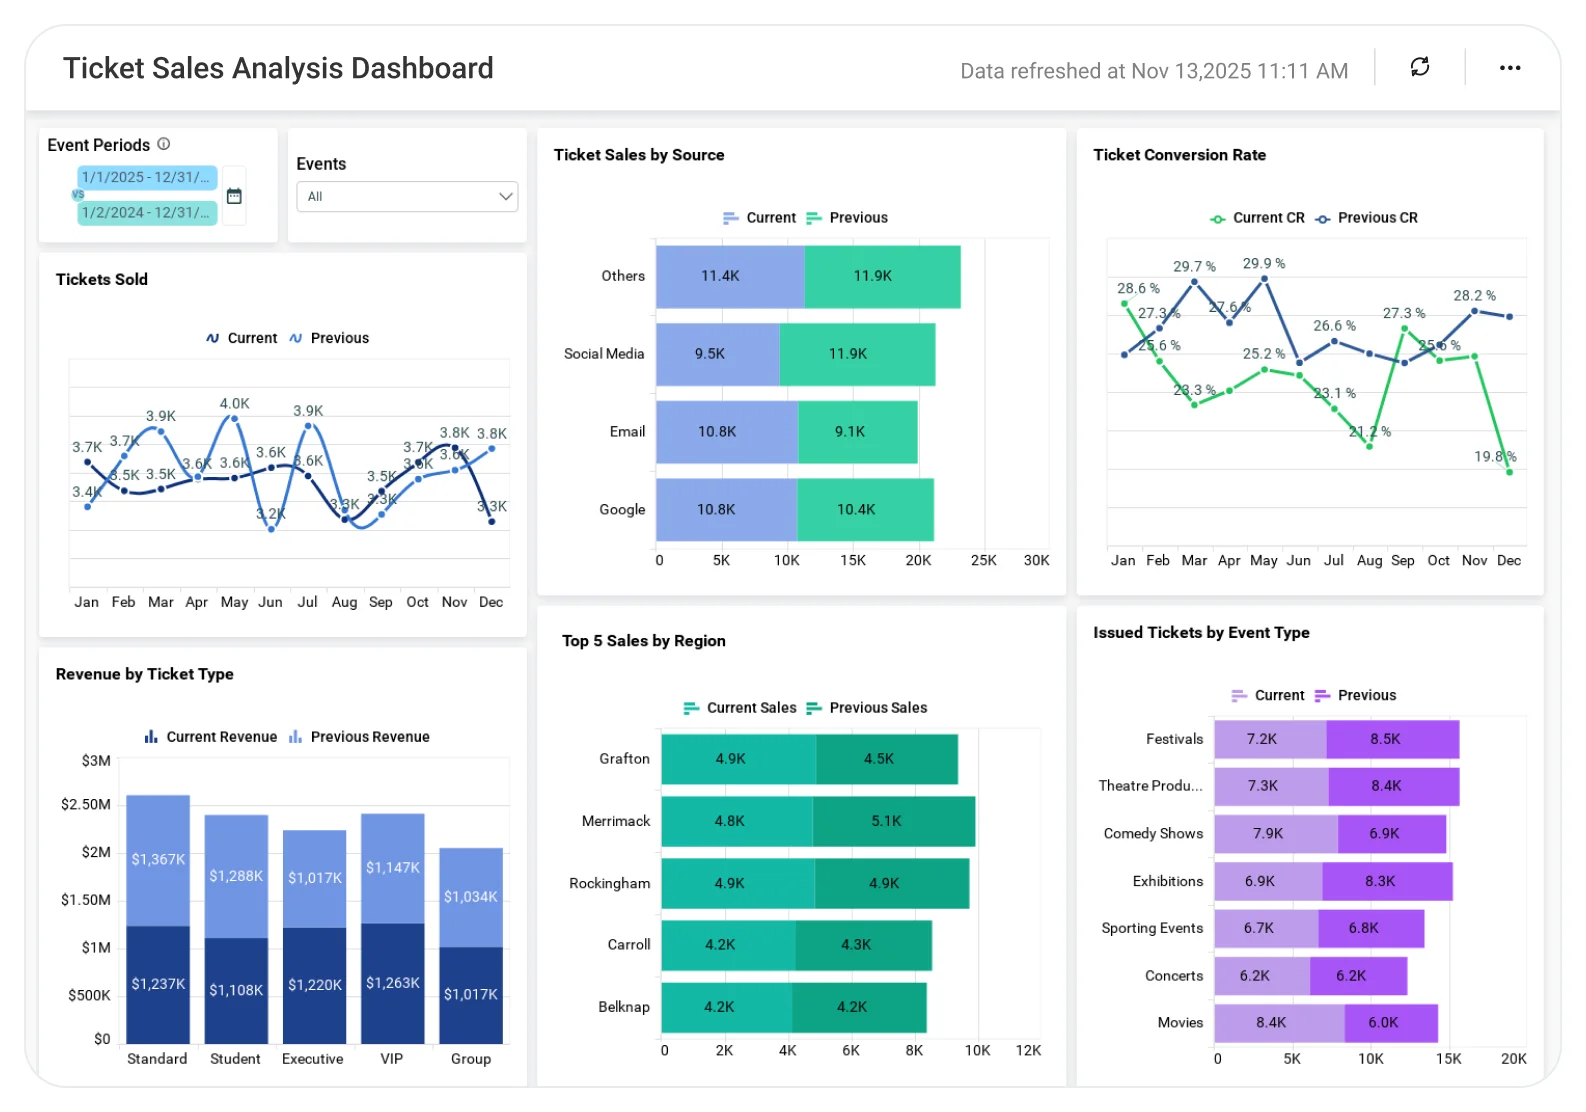
The Ticket Sales Analysis Dashboard helps teams analyze ticket sales trends, event-wise performance, and demand patterns, enabling better pricing strategies, accurate forecasting, and improved sales planning.
TL;DR
-
Total ticket sales across all shows.
-
Ticket sales before and after show launch.
-
Best-selling shows and daily sales trends.
-
Box offices generating the highest sales.
-
Searchable, detailed ticket sales records.
What Is Ticket Sales Analysis Dashboard?
A Ticket Sales Analysis Dashboard is a visual analytics tool that tracks ticket revenue, sales volume, show performance, and box office effectiveness.
In Bold BI, it becomes an interactive dashboard that lets users analyze sales by show, date, and sales channel, without manual reporting.
Why a Ticket Sales Analysis Dashboard Matters
Ticket sales are influenced by timing, marketing, venue, and audience interest, and these patterns are difficult to spot in raw data.
Without a centralized dashboard:
-
High-performing shows are harder to identify.
-
Pre-sale and post-launch trends go unnoticed.
-
Staffing and resource allocation across box offices lack clear data.
Bold BI brings ticket sales data together so teams can track performance, adjust promotions, and plan staffing with confidence.
What You’ll Track
-
Overall ticket sales: Monitor total ticket sales and compare pre-show and post-launch performance.
-
Show-level performance: Analyze ticket sales by show and by date to identify best- and low-performing productions.
-
Box office contribution: Track which ticket boxes sell the most tickets to support staffing and resource planning.
-
Sales trends over time: Review daily ticket sales patterns to understand demand changes across days, weeks, or months.
All dashboards are fully customizable, allowing you to add KPIs or metrics as needed.
How It Works
-
Connect ticket sales and box-office data.
-
Apply the Ticket Sales Analysis dashboard sample.
-
Analyze sales by show, date, and sales location.
-
Filter data using date range, show start date, or show name.
-
Share dashboards or embed them into internal systems.
Why Bold BI Is the Right Fit for Ticket Sales Analytics
-
Clear visibility into ticket demand and revenue trends.
-
Interactive charts for trend and performance analysis.
-
Drilldowns from summary views to detailed sales records.
-
Easy filtering without complex queries.
-
Deployment: cloud or self-hosted.
Compare Options (at a glance)
| Feature | Bold BI Ticket Sales Analysis Dashboard | Ticketing Platform Reports | Spreadsheets |
| Ticket sales & revenue tracking | Yes | Limited | Manual |
| Event-wise & category performance | Yes | Limited | Manual |
| Sales trends over time | Yes | Limited | Manual |
| Interactive filtering & drilldowns | Yes | Limited | No |
| Shareable, executive-ready dashboards | Yes | Limited | No |
Frequently Asked Questions
More Articles About Ticket Sales Analysis Dashboard
-
The Power of BI in the Freshdesk Support Ticket System
 This blog explores fundamental approaches, essential tools, and proven methodologies for leveraging the power of BI in the Freshdesk support ticket system, offering insights for better support ticket management.
-
Boost Your Revenue by Analyzing Ticket Sales Using Embedded Analytics
In this blog post, it is explained how embedded analytics can be used to help managers gain insights by monitoring a ticket sales analysis dashboard.


