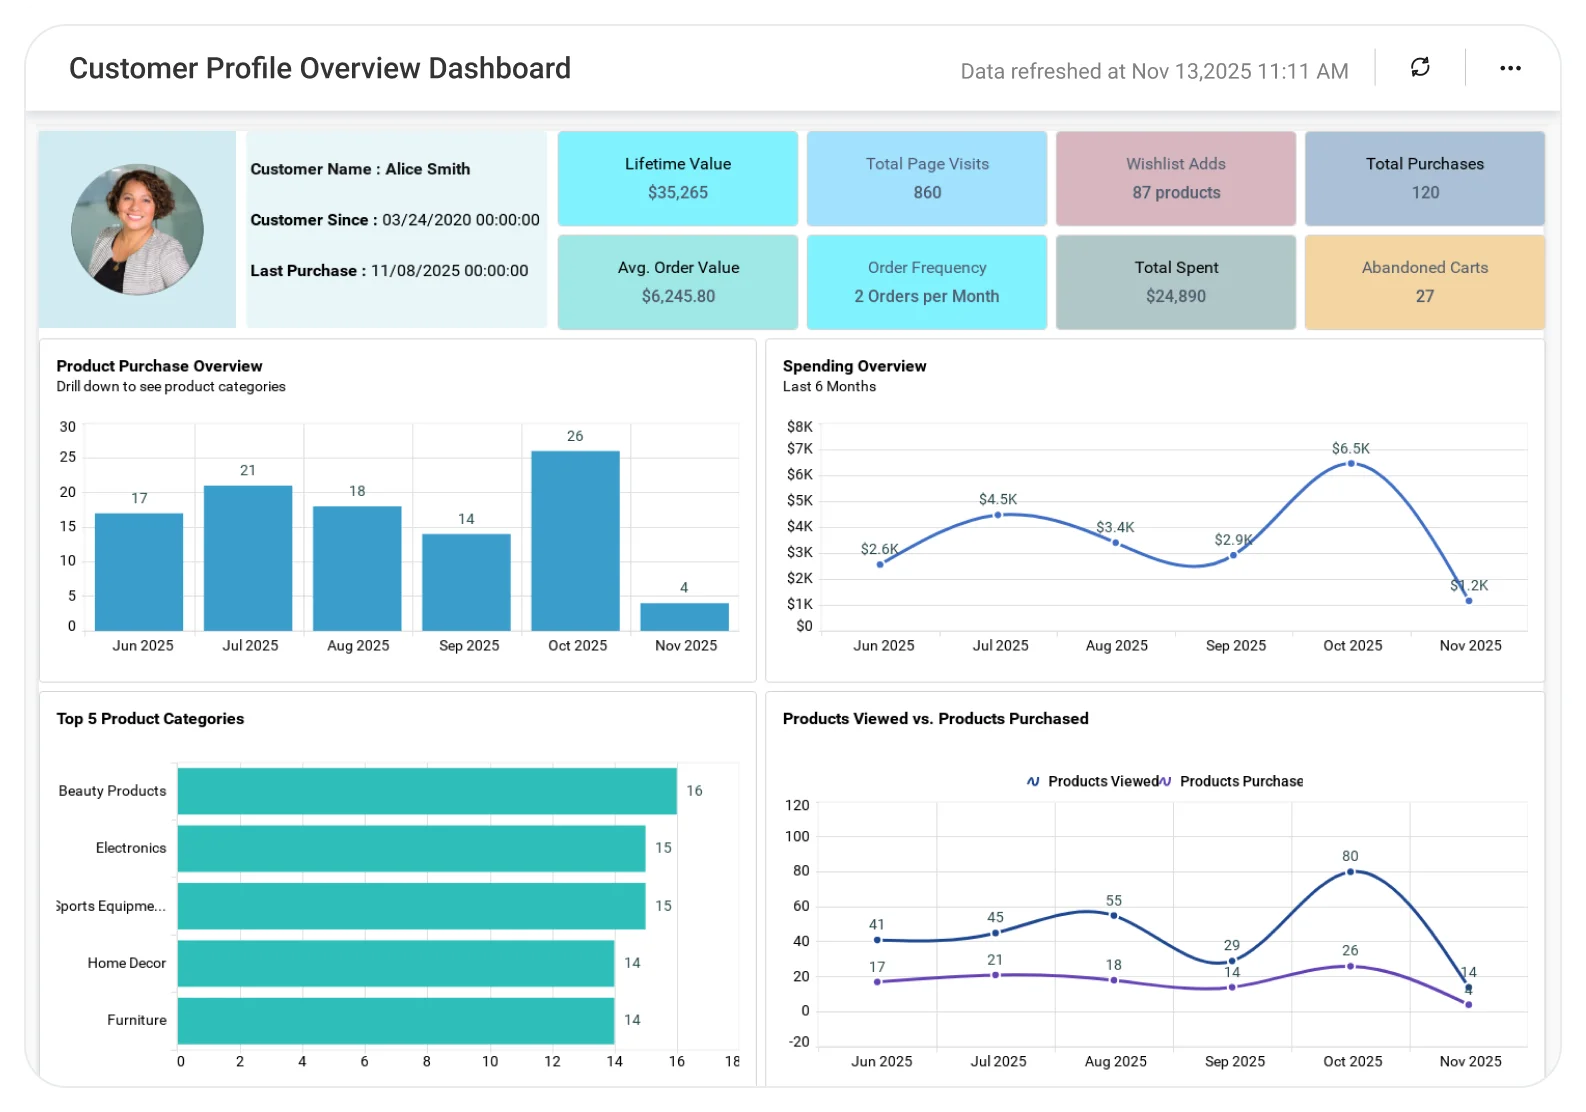
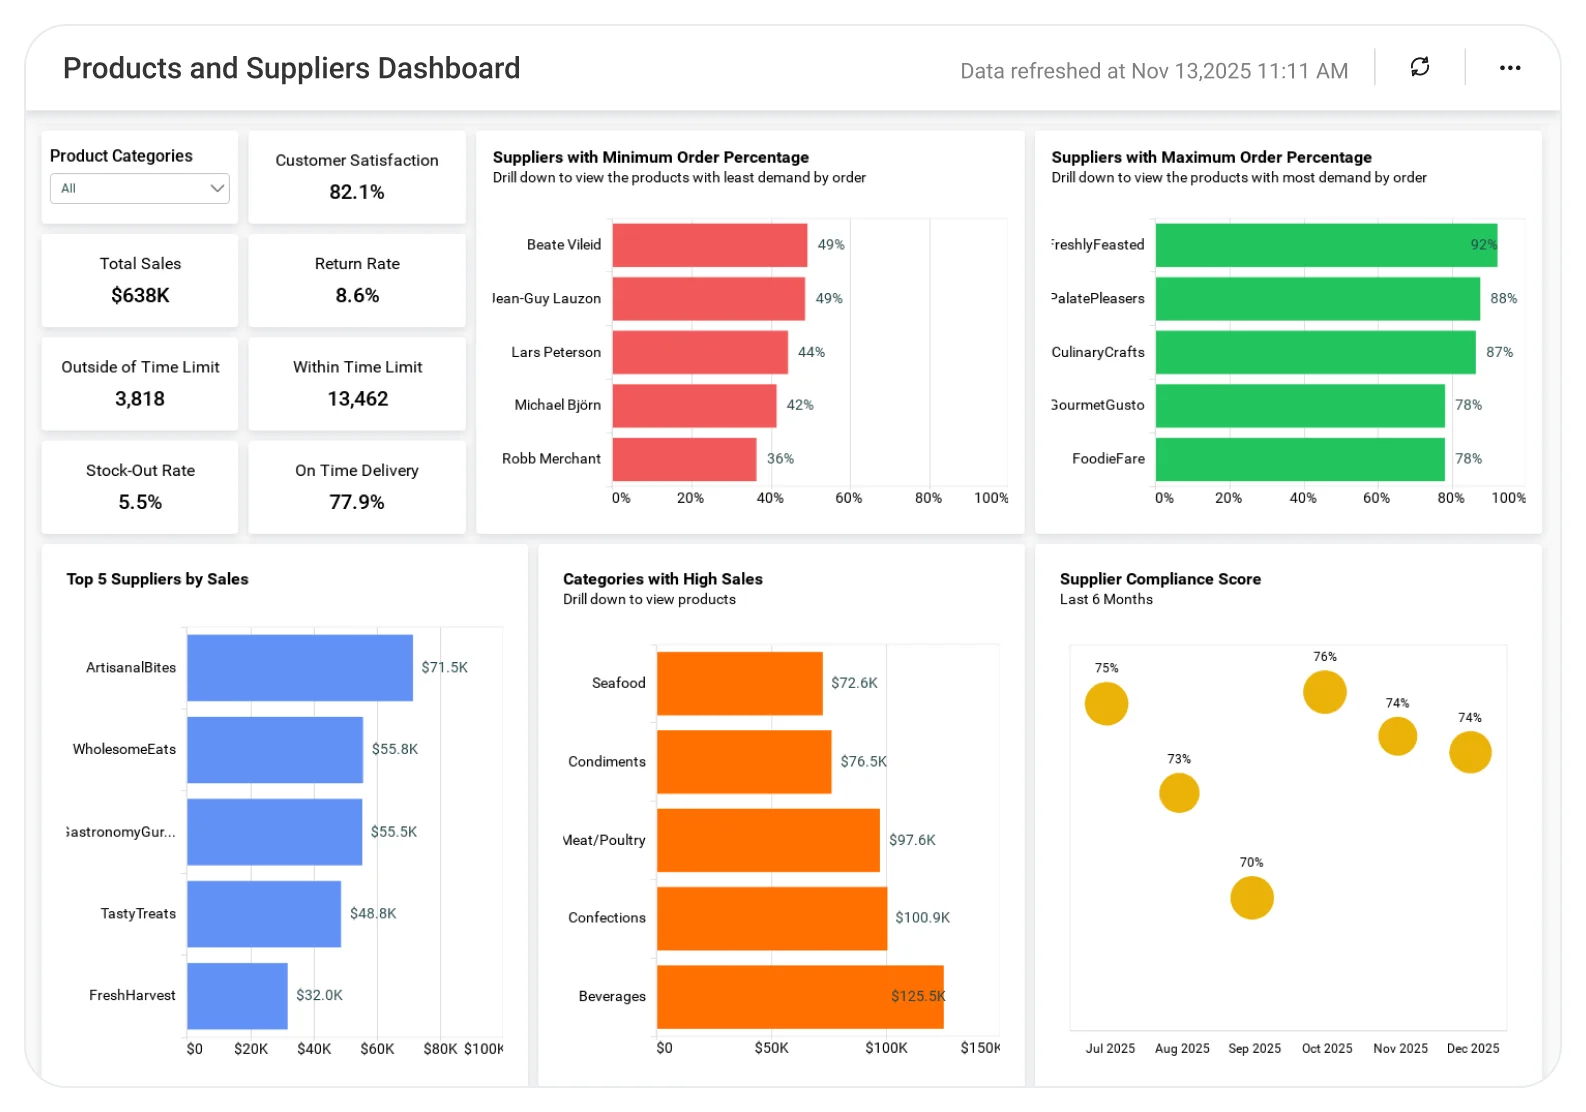
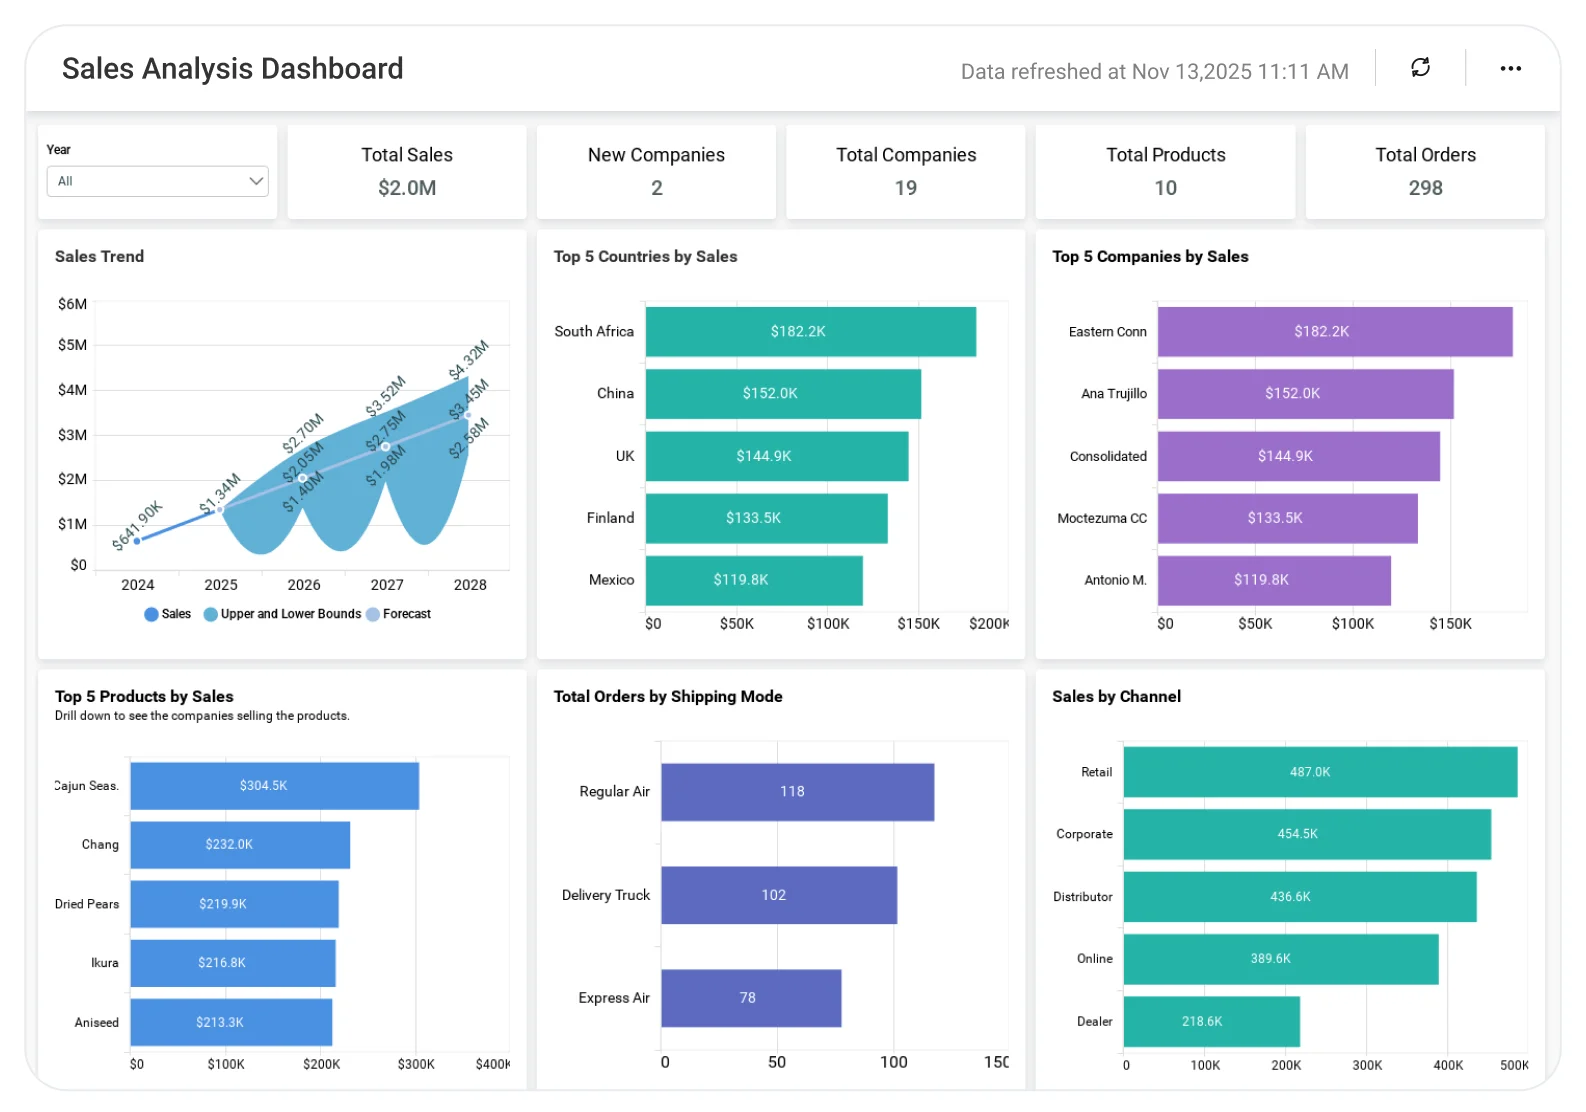
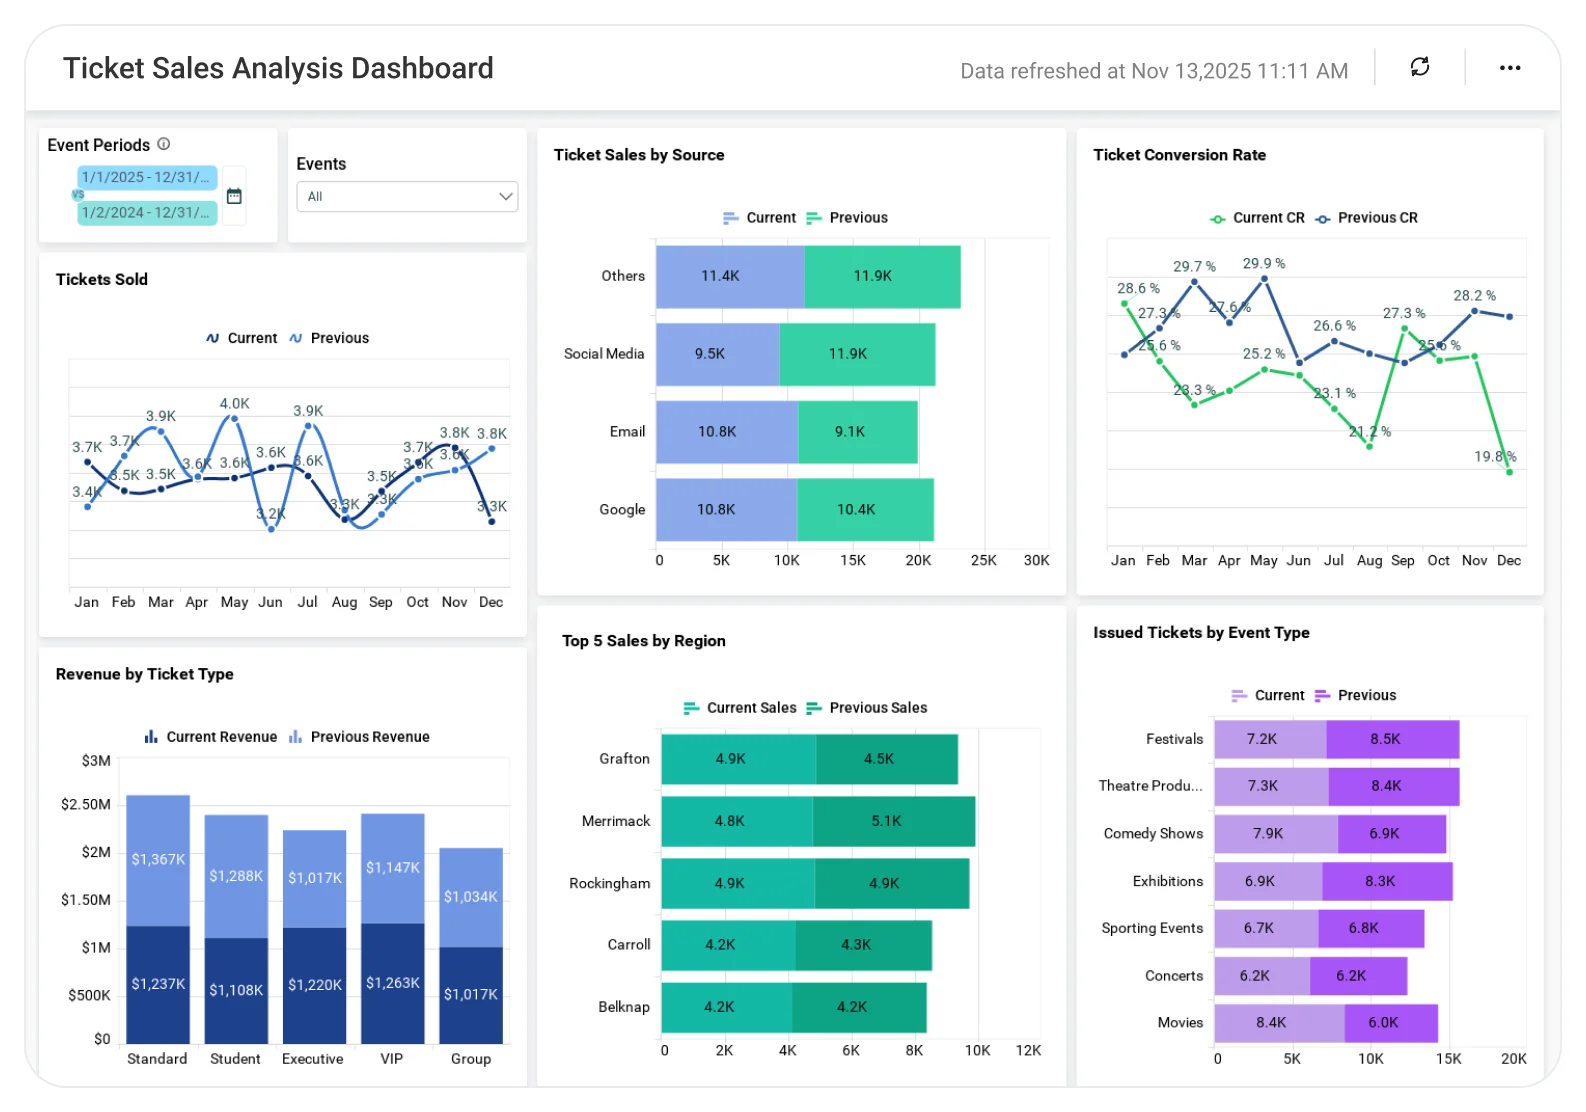
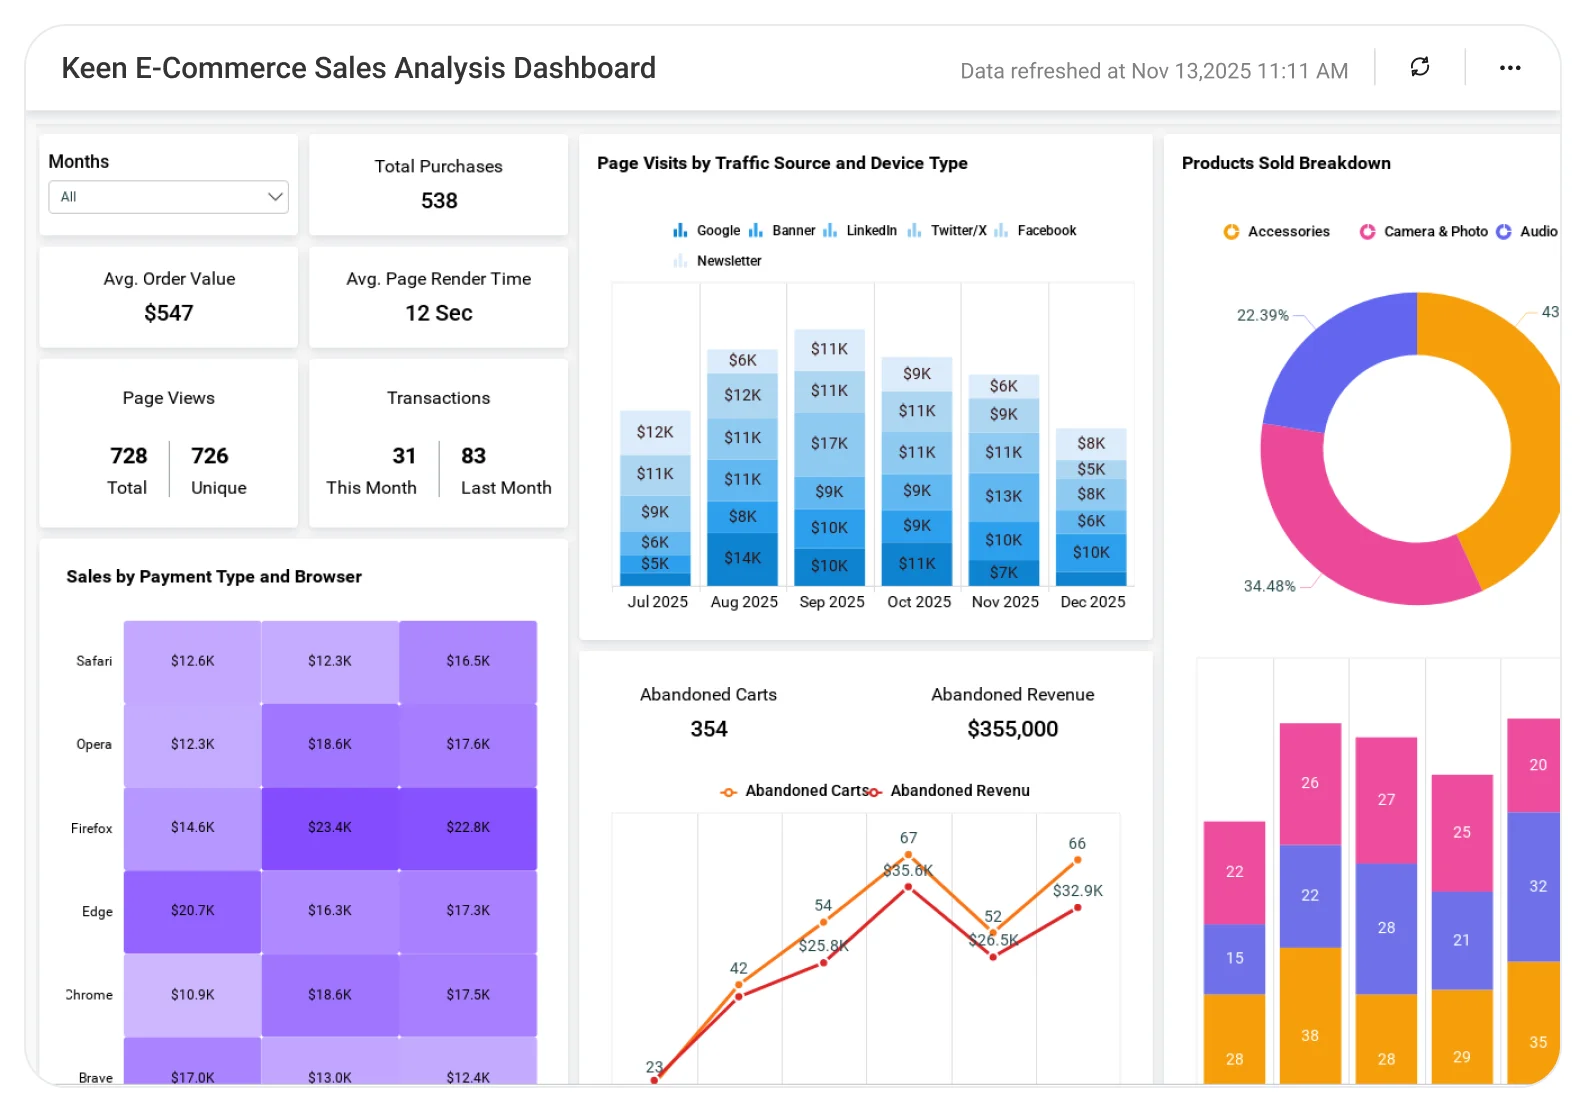
Keen E-Commerce Sales Analysis Dashboard
Understand e-commerce performance to improve sales, conversions, and customer experience.
The Keen E-Commerce Analytics Dashboard helps teams analyze online sales, customer behavior, product performance, and conversion trends, enabling data-driven decisions that drive revenue growth and optimize the shopping experience.
TL;DR
-
Live Revenue Feed : Monitor sales and transactions as they occur.
-
Revenue Momentum Trends : Spot growth or decline instantly.
-
Top Revenue Drivers : Products and categories that move the needle.
-
Anomaly Detection : Catch spikes and drops before they impact results.
-
One Executive View : Sales health, unified and real-time.
What Is a Keen E-Commerce Sales Analysis Dashboard?
A Keen E-Commerce Sales Analysis Dashboard is a visual analytics tool that uses Keen IO data to track real-time sales activity, revenue trends, and product performance.
In Bold BI, it becomes an interactive, customizable dashboard that helps e-commerce teams make faster, smarter, and more competitive decisions.
Why Keen E-Commerce Sales Analytics Matters
In fast-moving e-commerce environments, delayed insights mean missed opportunities.
Without real-time visibility, sales teams struggle to answer critical questions like:
-
How are sales performing right now?
-
Which products are driving the most revenue?
-
Are revenue trends improving or declining?
-
Where should we optimize pricing, promotions, or inventory?
The Keen E-Commerce Sales Analysis Dashboard answers these questions instantly empowering teams to act with confidence.
What You’ll Track
The Keen E-Commerce Sales Analysis Dashboard helps teams monitor real-time performance and revenue trends with clarity:
-
Real-Time Sales Performance: Track live revenue and transaction activity as it happens, without waiting for reports.
-
Revenue Trends Over Time: Analyze historical and current sales trends to understand growth patterns and performance shifts.
-
Top-Selling Products & Categories: Identify products and categories that drive the most revenue and focus efforts where impact is highest.
-
Performance Anomalies & Opportunities: Spot sudden spikes, drops, or unusual patterns early and respond quickly to market or campaign changes.
-
Unified Sales Overview: Get a consolidated, executive-ready view of overall e-commerce sales health in one dashboard.
All metrics are fully customizable, enabling faster and more confident sales decisions.
How It Works
-
Connect your Keen IO data source.
-
Apply the Keen E-Commerce Sales Analysis Dashboard sample.
-
Visualize real-time and historical sales metrics.
-
Share dashboards securely with sales teams and leadership.
-
Act on insights to optimize performance and revenue.
Why Bold BI Is the Right Fit for Keen E-Commerce Sales Analytics
-
Seamless integration with Keen IO analytics.
-
Real-time and interactive sales dashboards.
-
Clear, visual KPIs for faster understanding.
-
Enterprise-grade security with Single Sign On, Role Based Access Control and Row Level Security.
-
Embeddable dashboards for internal sales portals.
-
Cloud or self-hosted deployment options.
Compare Options (at a glance)
| Feature | Bold BI Keen E-Commerce | Keen Default Views | Spreadsheets |
| Real-time sales visibility | Yes | Limited | No |
| Revenue trend analysis | Yes | Limited | Manual |
| Product-level performance insights | Yes | Limited | Manual |
| Interactive filtering & drilldowns | Yes | No | No |
| Shareable, executive-ready dashboards | Yes | Limited | No |