

Shopify Product Monitoring Dashboard
Understand Shopify sales performance to improve revenue and customer engagement.
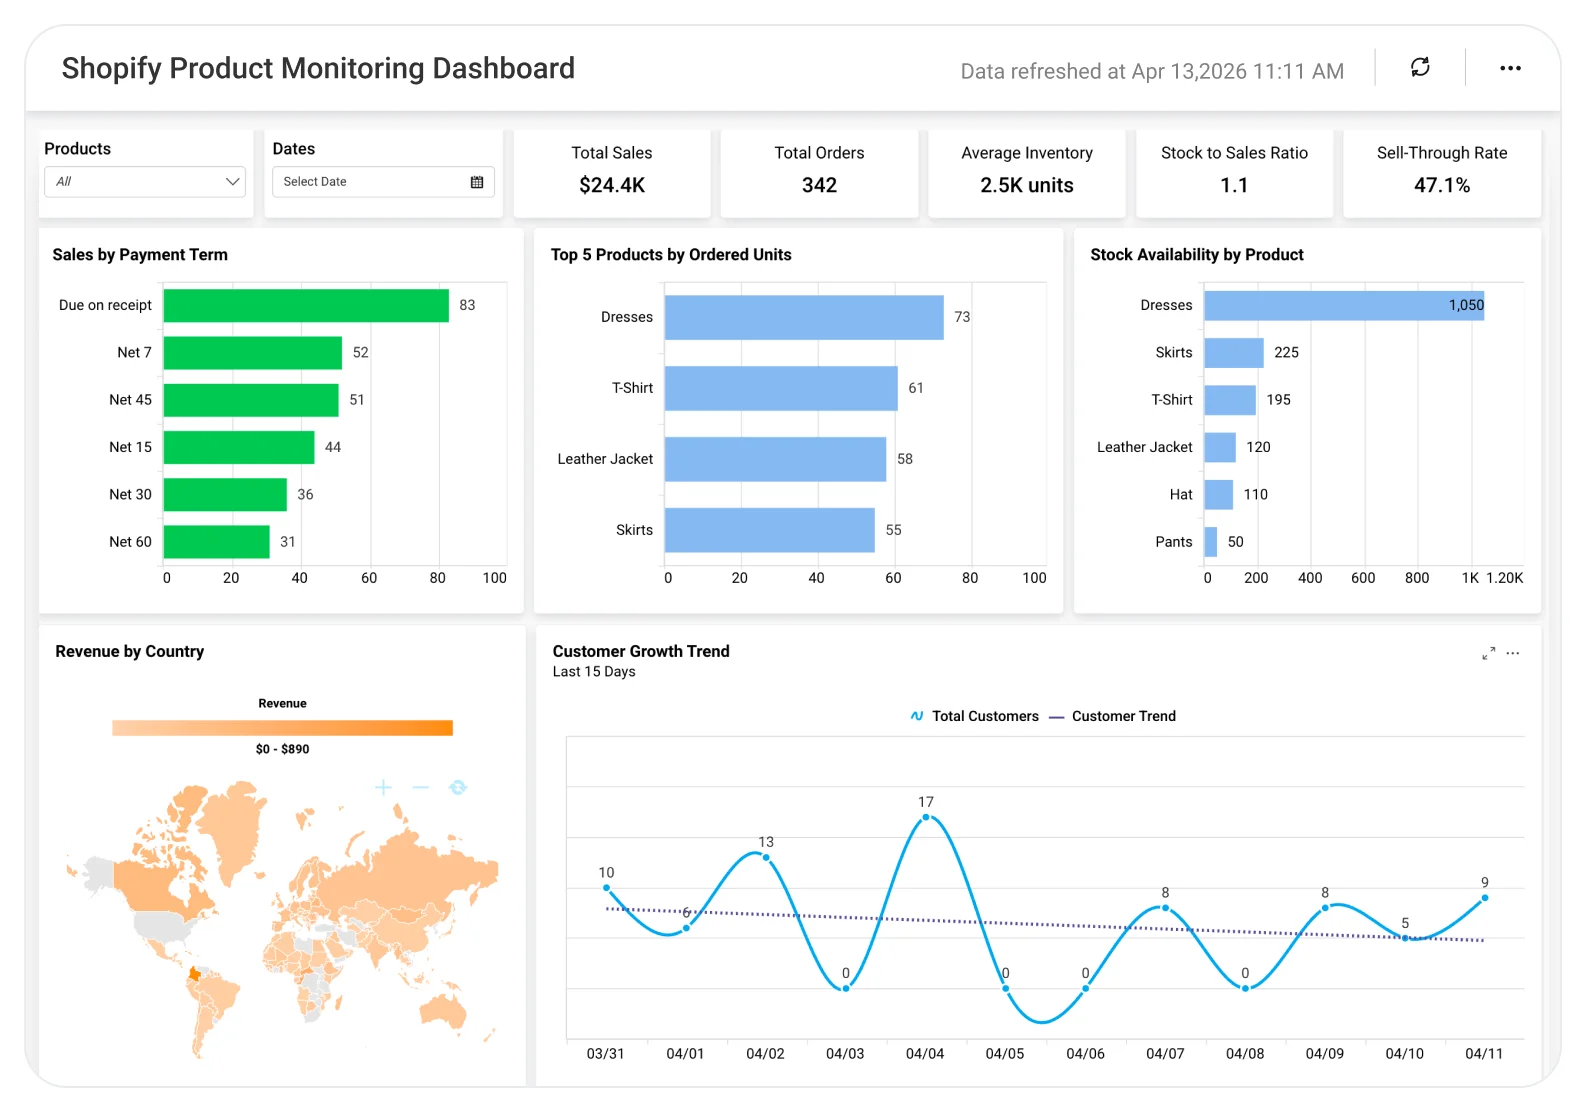
The Shopify Sales Dashboard helps teams analyze orders, revenue, product performance, and customer trends, enabling better sales planning, inventory decisions, and sustained e-commerce growth.
TL;DR
A single, executive-ready view of Shopify store performance.
-
Total sales and total orders at a glance.
-
Product price comparison vs competitors.
-
Average inventory levels and sell-through rates by product.
-
Stock-to-sales ratio and inventory health KPIs.
-
Sales by country and geographic demand patterns.
-
Customer count trends over the last 30 days.
What Is a Shopify Product Monitoring Dashboard?
A Shopify Product Monitoring Dashboard is a visual analytics tool that tracks product pricing, sales performance, inventory levels, and customer trends for an online store.
In Bold BI, it becomes an interactive, customizable dashboard that helps e-commerce teams optimize pricing, manage inventory efficiently, and scale sales with confidence.
Why Shopify Product Monitoring Dashboard Matters
Running a successful Shopify store requires more than tracking revenue, you need to understand pricing competitiveness, inventory efficiency, and customer momentum.
Without a centralized dashboard, store managers struggle to answer key questions like:
-
How do our prices compare against competitors?
-
Are we holding too much or too little inventory?
-
Which products and regions drive the most sales?
-
Is our customer base growing or slowing down?
The Shopify Product Monitoring Dashboard answers these questions in one place, enabling faster, more confident decisions.
What You’ll Track
The Shopify Product Monitoring Dashboard brings together the metrics that matter most for revenue, growth, and inventory planning:
-
Sales & Order Performance: Track total sales and total orders to understand overall business performance and goal progress.
-
Pricing & Market Positioning: Compare your product prices with competitors to maintain profitable and competitive pricing.
-
Customer Growth & Momentum:Monitor customer trends over the last 30 days to spot growth opportunities or early slowdowns.
-
Inventory Health & Efficiency: Analyze sell-through rate, average inventory, stock-to-sales ratio, and product availability to avoid stockouts and excess inventory.
-
Product & Geographic Insights: Identify top-performing products and regions using product-level and country-wise sales data.
-
Focused Analysis with Filters: Use product filters and flexible date ranges to drill into trends and evaluate decisions over time.
All metrics are fully customizable, helping teams act faster with confidence.
How It Works
-
Connect Shopify sales and inventory data.
-
Apply the Shopify Product Monitoring Dashboard sample.
-
Blend pricing, sales, inventory, and customer metrics.
-
Share dashboards securely with store managers and leadership.
-
Act on insights to optimize pricing, stock, and sales strategies.
Why Bold BI Is the Right Fit for Shopify Product Monitoring Analytics
-
Unified view of sales, inventory, pricing, and customers.
-
Interactive visuals with filters and drilldowns.
-
Real-time and historical performance tracking.
-
Enterprise-grade security with Single Sign On, Role Based Access Control and Row Level Security.
-
Embeddable dashboards for internal e-commerce portals.
-
Cloud or self-hosted deployment options.
Compare Options (at a glance)
| Feature | Bold BI Shopify Product | Shopify Admin Reports | Spreadsheets |
| Sales & order performance tracking | Yes | Limited | Manual |
| Pricing vs competitor comparison | Yes | No | Manual |
| Inventory health & sell-through analysis | Yes | Limited | Manual |
| Product & region performance insights | Yes | Limited | Manual |
| Interactive filters & drilldowns | Yes | Limited | No |


