Asana Project Management Dashboard
Get a clear overview of project status to support better planning and execution.
The Project Overview Dashboard helps teams understand project progress, timelines, key milestones, and overall health, enabling informed decisions, improved coordination, and successful project delivery.
TL;DR
-
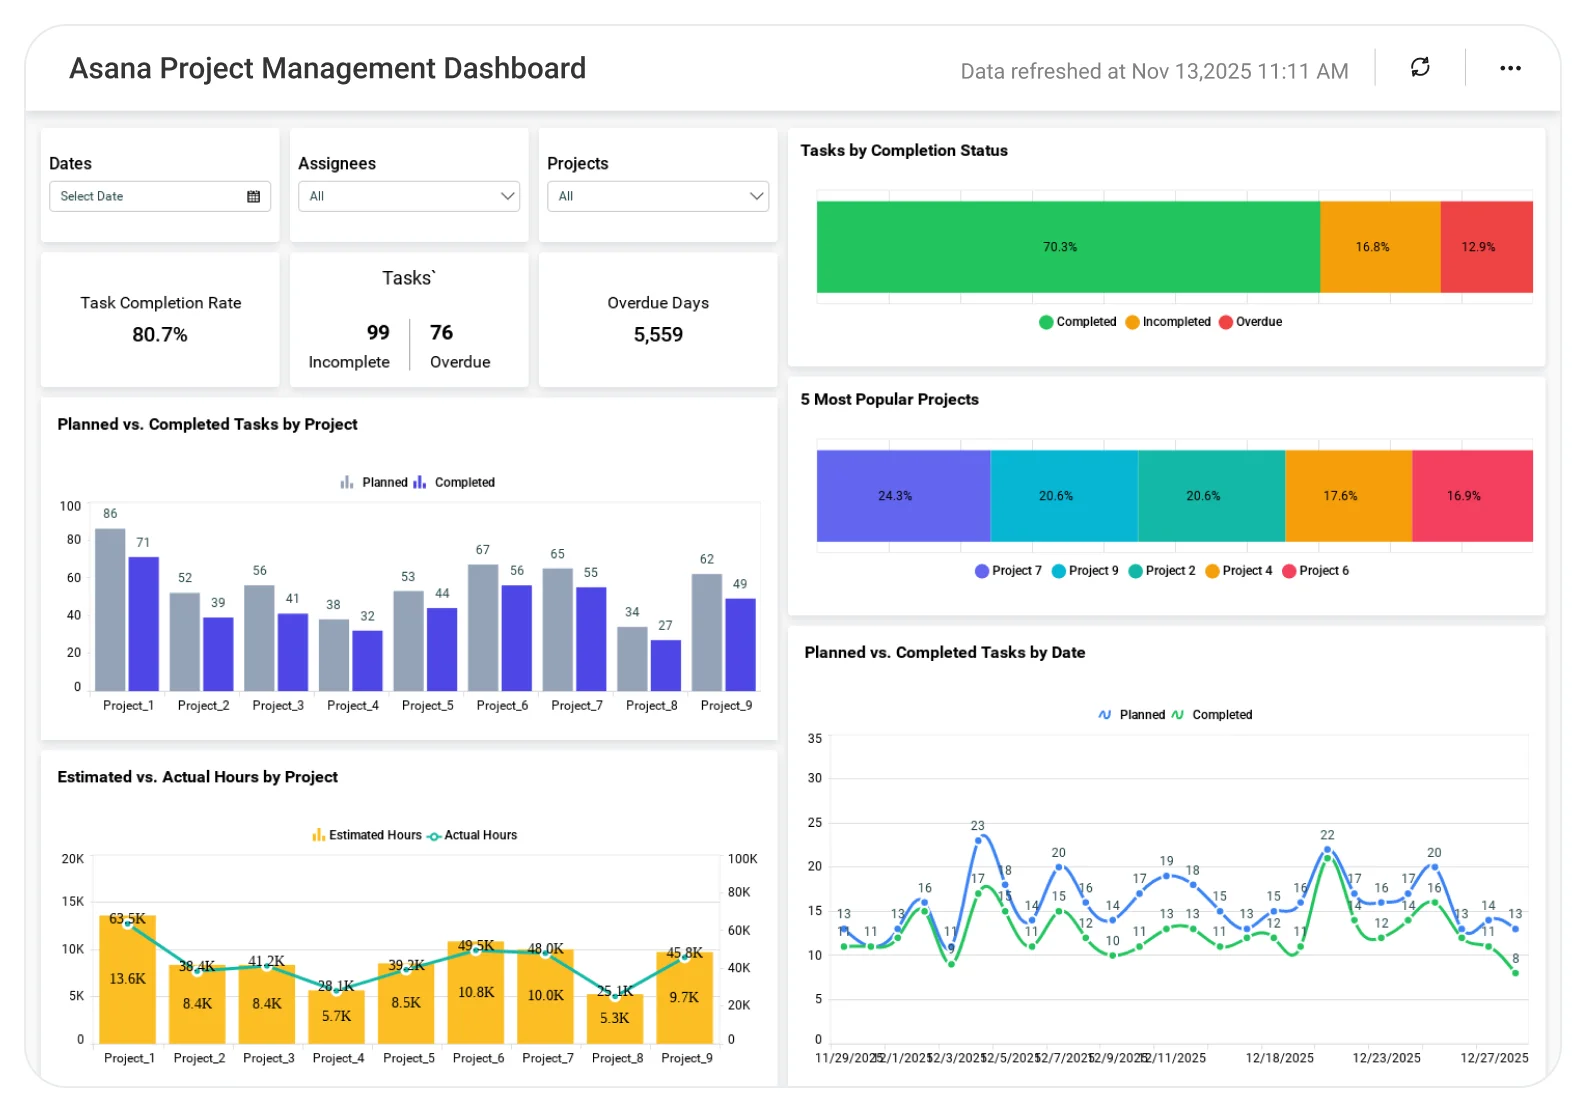
Total projects in progress.
-
Task completion rate and overdue tasks.
-
Planned vs. completed tasks by project.
-
Incomplete tasks by assignee.
-
Estimated vs. actual hours.
-
Task-level execution details.
What Is a Project Overview Dashboard?
A Project Overview Dashboard provides a real-time view of project progress, task status, workload distribution, and delivery risks.
In Bold BI, it combines project and task data from tools like Asana into interactive visuals that help teams monitor execution and improve on-time delivery.
Why Project Overview Dashboard Matters
As teams manage more projects across tools, it becomes harder to see progress, workload, and risks in one place.
Without a centralized dashboard:
-
Overdue tasks go unnoticed.
-
Team workloads become uneven.
-
Time estimates drift from reality.
-
Leaders react too late to delivery risks.
Bold BI provides a single operational view of project health thus helping teams identify risks early and act before deadlines slip.
What You’ll Track
-
Project Execution Overview:Track total projects, task completion rate, outstanding work, and overdue tasks to understand overall project health.
-
Task Status Distribution: Monitor completed, incomplete, and overdue tasks across projects to quickly spot delivery risks.
-
Team Workload & Bottlenecks: Analyze incomplete and overdue tasks by assignee and by project to balance workloads and prevent burnout.
-
Planning Accuracy & Trends: Compare planned vs. completed tasks and estimated vs. actual hours to evaluate time estimation accuracy and execution trends.
-
Task-Level Details: Drill into individual tasks with project name, assignee, task type, status, and due date for quick action.
All dashboards are fully customizable so you can add KPIs, apply filters, and drill down by project, assignee, or date to get real-time visibility into delivery progress.
How It Works
-
Connect Asana or other project management data.
-
Apply the Project Overview Dashboard sample.
-
Analyze project health and workload in real time.
-
Drill down by project, assignee, or date.
-
Share dashboards with IT and project leadership.
Why Bold BI Is the Right Fit for Asana Project Management Analytics
-
A single dashboard that combines projects, tasks, and time metrics.
-
Clear visibility into overdue work and risks.
-
Interactive filters and drilldowns.
-
Enterprise-grade security with Single Sign On, Role Based Access Control and Row Level Security.
-
Secure embedding into PMO or IT portals.
-
Cloud or self-hosted deployment.
Compare Options (at a glance)
| Feature | Bold BI | Asana | Spreadsheets |
| Project & task visibility | Yes | Partial | Manual |
| Task status & overdue tracking | Yes | Limited | Manual |
| Workload by assignee | Yes | Limited | Manual |
| Time & trend analysis | Yes | No | Manual |
| Customization | Yes | Fixed | Limited |
| Deployment | Cloud / self-hosted | SaaS only | Local |