Harvest Project Time Tracking Dashboard
Improve team productivity by understanding how time is spent across projects and tasks.
The Harvest Time Tracking Dashboard helps teams analyze logged hours, project-wise effort, and utilization trends, enabling better workload planning, accurate billing, and improved delivery efficiency.
TL;DR
-
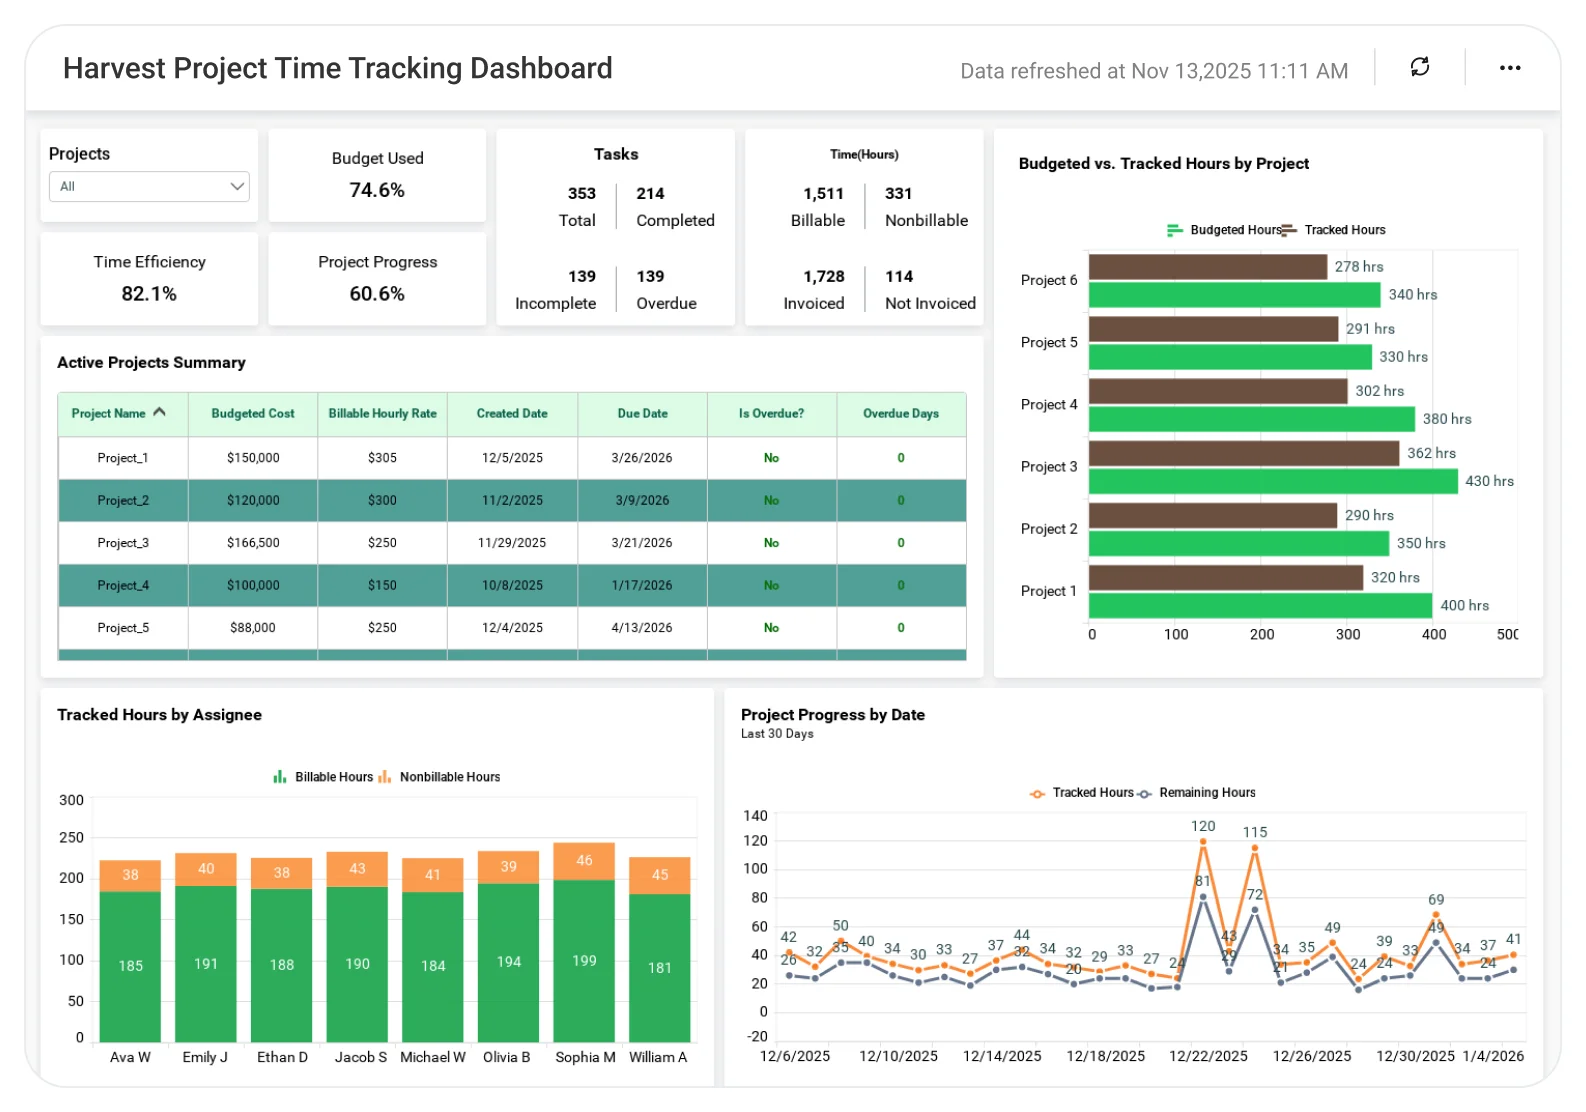
Completed vs. incomplete and overdue tasks.
-
Billable vs. non-billable tracked hours.
-
Budgeted vs. actual hours by project.
-
Project progress trends over the last 30 days.
-
Financial details of active projects.
What Is a Harvest Project Time Tracking Dashboard?
The Harvest Project Time Tracking Dashboard turns Harvest time tracking data into visual KPIs that help project managers spot risks, track progress, and control budgets in real time.
In Bold BI, this means interactive KPIs, charts, and grids that help managers understand whether projects are on time, over budget, or at risk.
Why Harvest Project Time Tracking Dashboard Matters
Project managers juggle multiple constraints like time, budget, and delivery.
Without clear visibility:
-
Projects exceed time budgets unnoticed.
-
Overdue tasks pile up.
-
Billable utilization drops.
-
Deadlines and profitability are put at risk
Bold BI helps teams turn Harvest data into clear, actionable insights, helping managers keep projects on track and teams productive.
What You’ll Track
-
Task completion & workload health: Track total, completed, incomplete, and overdue tasks to understand execution status.
-
Time utilization metrics: Monitor billable vs. non-billable hours and invoiced vs. non-invoiced time.
-
Budget vs. tracked hours: Compare planned time budgets with actual tracked hours by project.
-
Project progress & financials: Analyze tracked vs. remaining hours over time and review active project budget and rate details.
All dashboards are fully customizable so you can add KPIs or metrics as needed.
How It Works
-
Connect Harvest time tracking data using the Harvest integration.
-
Apply the Harvest Project Time Tracking Dashboard sample.
-
Filter data using the Projects dropdown.
-
Analyze tasks, time, and budgets in real time.
-
Share dashboards with project managers and leadership.
Why Bold BI Is the Right Fit for Harvest Project Time Tracking Analytics
-
Unified project visibility: Track tasks, time, budgets, and utilization in one dashboard.
-
Better cost & schedule control: Compare tracked hours with budgeted time to prevent overruns and missed deadlines.
-
Improved utilization & profitability: Monitor billable vs. non-billable hours and focus on high-return projects.
-
Instant project health checks: Use clear visuals and gauges to assess project status at a glance.
-
Secure & embeddable analytics: Share dashboards safely using Row Level Security(RLS), Single Sign On(SSO), and Role Based Access Control(RBAC), and embed them into PMO or project tools.
-
Flexible deployment: Deploy securely in cloud or self-hosted environments.
Compare Options (at a glance)
| Feature | Bold BI | Harvest Reports | Spreadsheets |
| Task & time visibility | Yes | Partial | Manual |
| Budget vs. actual analysis | Yes | Limited | Manual |
| Utilization metrics | Yes | Limited | Manual |
| Project-level drilldowns | Yes | Limited | Manual |
| Deployment | Cloud / self-hosted | SaaS only | Local |
Frequently Asked Questions
More Articles About Harvest Project Time Tracking Dashboard
-
Why You Should Choose Bold BI for Embedded Analytics
 Explains why Bold BI is ideal for embedding analytics, helping project managers gain real-time insights for better control.
-
What Is Embedded Analytics? Benefits, Examples, and Uses
Discusses embedded analytics, its advantages, and practical usecases to improve project tracking and decision-making.