
Information Technology
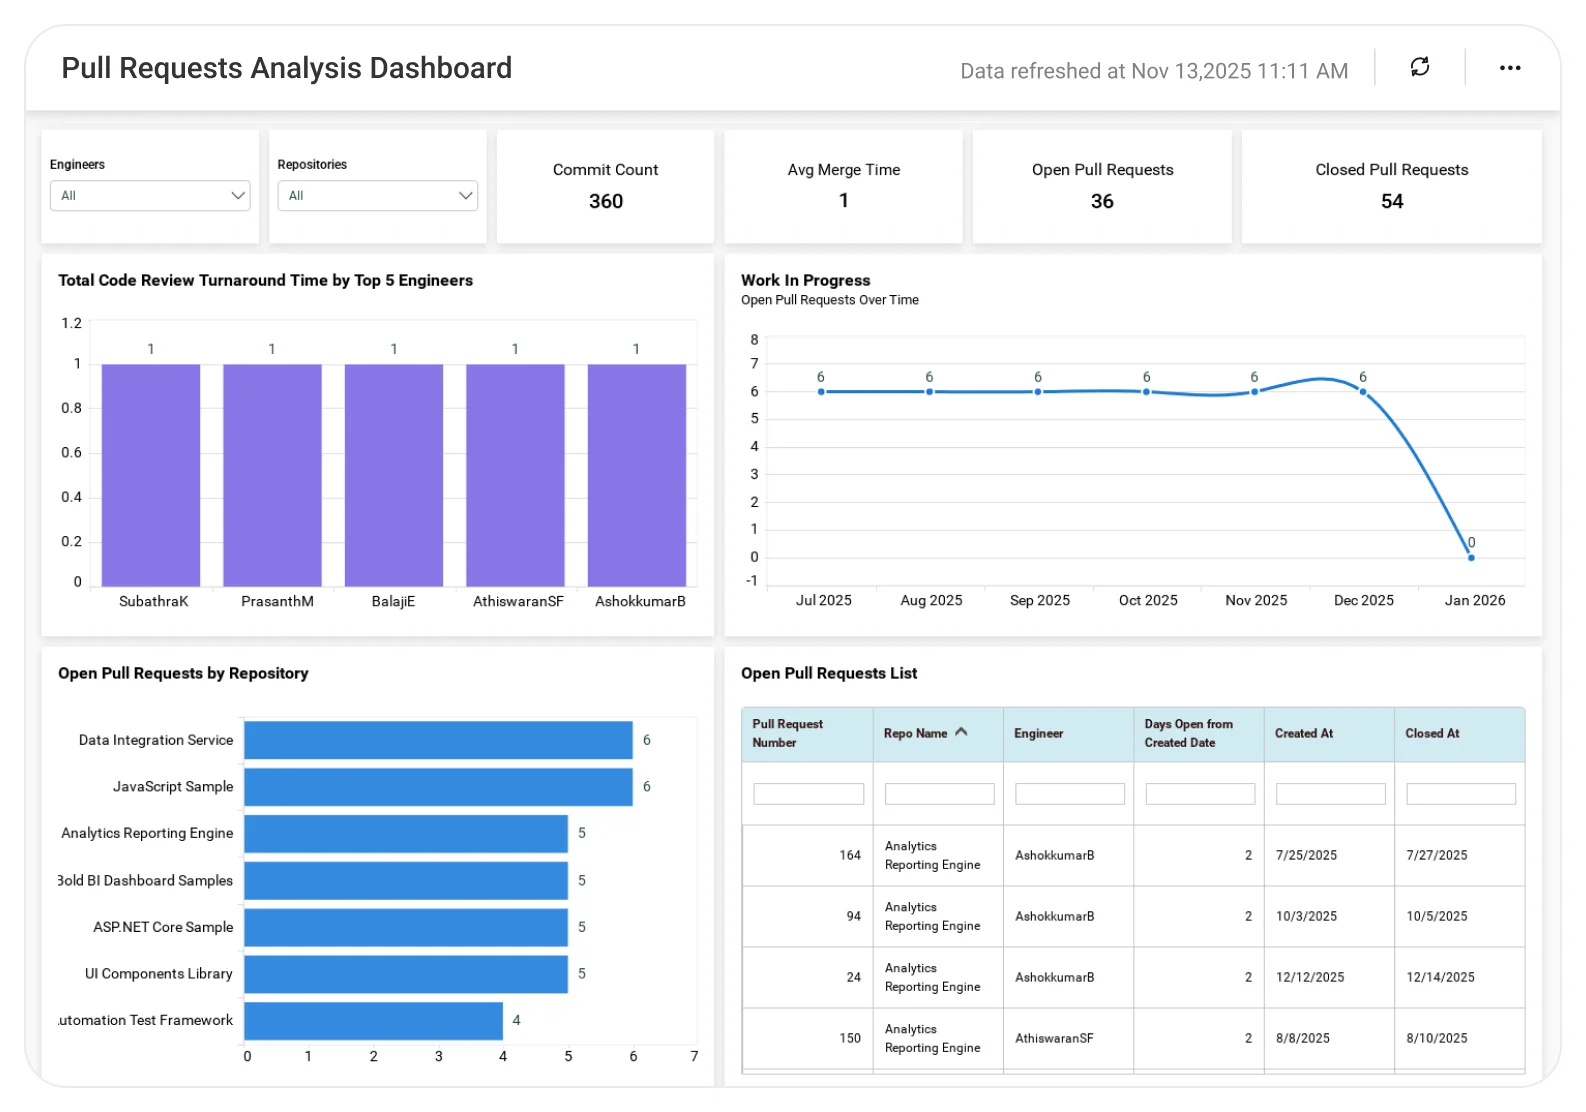
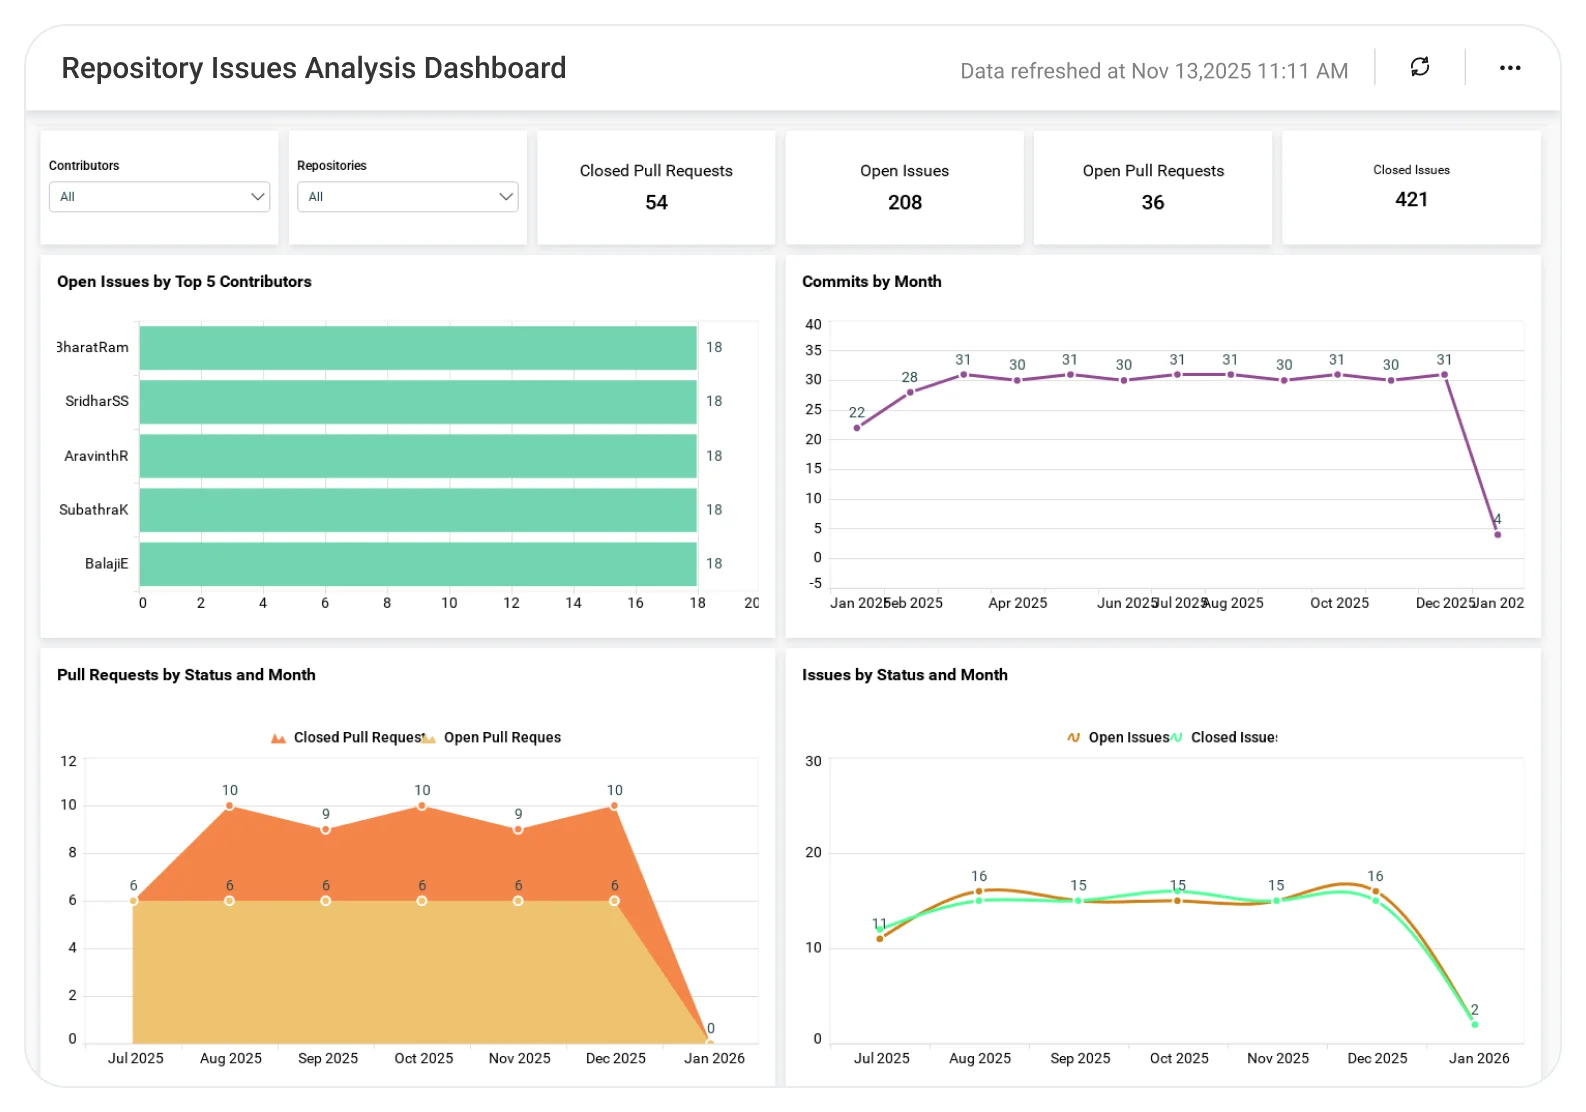
Pull Requests Analysis Dashboard
Track pull request volume, review time, and merge cycles in one dashboard to improve engineering workflows.
The Pull Requests Analysis Dashboard gives engineering leaders and development teams a single view of pull request volume, review efficiency, and merge patterns, helping them reduce bottlenecks and ship faster with more predictable workflows.
TL;DR
What Is a Pull Requests Analysis Dashboard ?
A Pull Requests Analysis Dashboard is an analytics solution that helps software teams understand how efficiently code changes move through review and merge stages.
In Bold BI, this dashboard connects with GitHub pull request data to consolidate activity, review behavior, and outcomes, supporting informed decisions around team productivity and development process improvements.
Why Pull Requests Analysis Dashboard Matters
Pull requests are a critical checkpoint for code quality and delivery speed.
When pull request data is reviewed only through repository views:
A centralized dashboard helps teams spot review delays earlier, balance workloads, and continuously improve their development process.
What You’ll Track
Using Bold BI dashboards, you will track important KPIs such as:
All samples are easy to tailor, allowing you to add your own KPIs or connect data from any department.
How It Works
Why Bold BI Is the Right Fit for Pull Requests Analysis Analytics
Compare Options (at a glance)
| Feature | Bold BI | GitHub Repository Views | Spreadsheets |
| Pull request analytics | Yes | Limited | Manual |
| Review & merge time insights | Yes | Partial | Manual |
| Cross-repository comparison | Yes | Limited | Manual |
| Contributor performance views | Yes | Limited | Manual |
| Custom KPIs & drilldowns | Fully customizable | Fixed | Manual |
Frequently Asked Questions
Simple Pricing That Grows With You
Say goodbye to hidden costs, complex quotes, and pricing guesswork.
Clear ROI from Day One
No complicated quotes—just honest, value-driven pricing that delivers more for less, right from the start.
Built to Grow with You
From startup to scale-up, Bold BI grows with your business — no forced upgrades, just flexible, future-ready analytics.
Fits Every Budget
Whether you're a startup or an enterprise, our flexible pricing scales with your growth— Pay only for what you truly need.
Trusted & recognized
Analytics that wins awards and users
Recognized by G2, TrustRadius, and Visual Studio Magazine for delivering standout performance and value.
I appreciate Bold BI for making it easier to provide reporting for our customers, allowing both our analysts and customers to easily build and publish reports. The ability to build dashboards and modify queries for specific outcomes is very user-friendly. I value the mobile readiness of the app and its integration capabilities with API structures. The addition of AI features is impressive. The economic pricing model and the effective partnership, which includes consistent and helpful support, make it an invaluable tool for our OEM model.
The support from Bold is unmatched. They do not charge extra for support and it is excellent anyway. All our tickets and questions are quickly answered with authoritative and precise guidance. This is important at the product is complex, powerful and mature. To get the most out of the tool, the level of support they provide is essential.
It was easy to implement data visualizations into our product. The standard widgets allowed us to build professional looking dashboards, and a robust API provided excellent control of the development and runtime process from within our application.



Recognition








Ready to Get Started?
Start your 30-day free trial instantly
Easy integration, AI-Powered Dashboards and 24x5 real-time support.