Trello Project Overview Dashboard for Project Managers
Understand project progress and collaboration to improve planning and delivery.
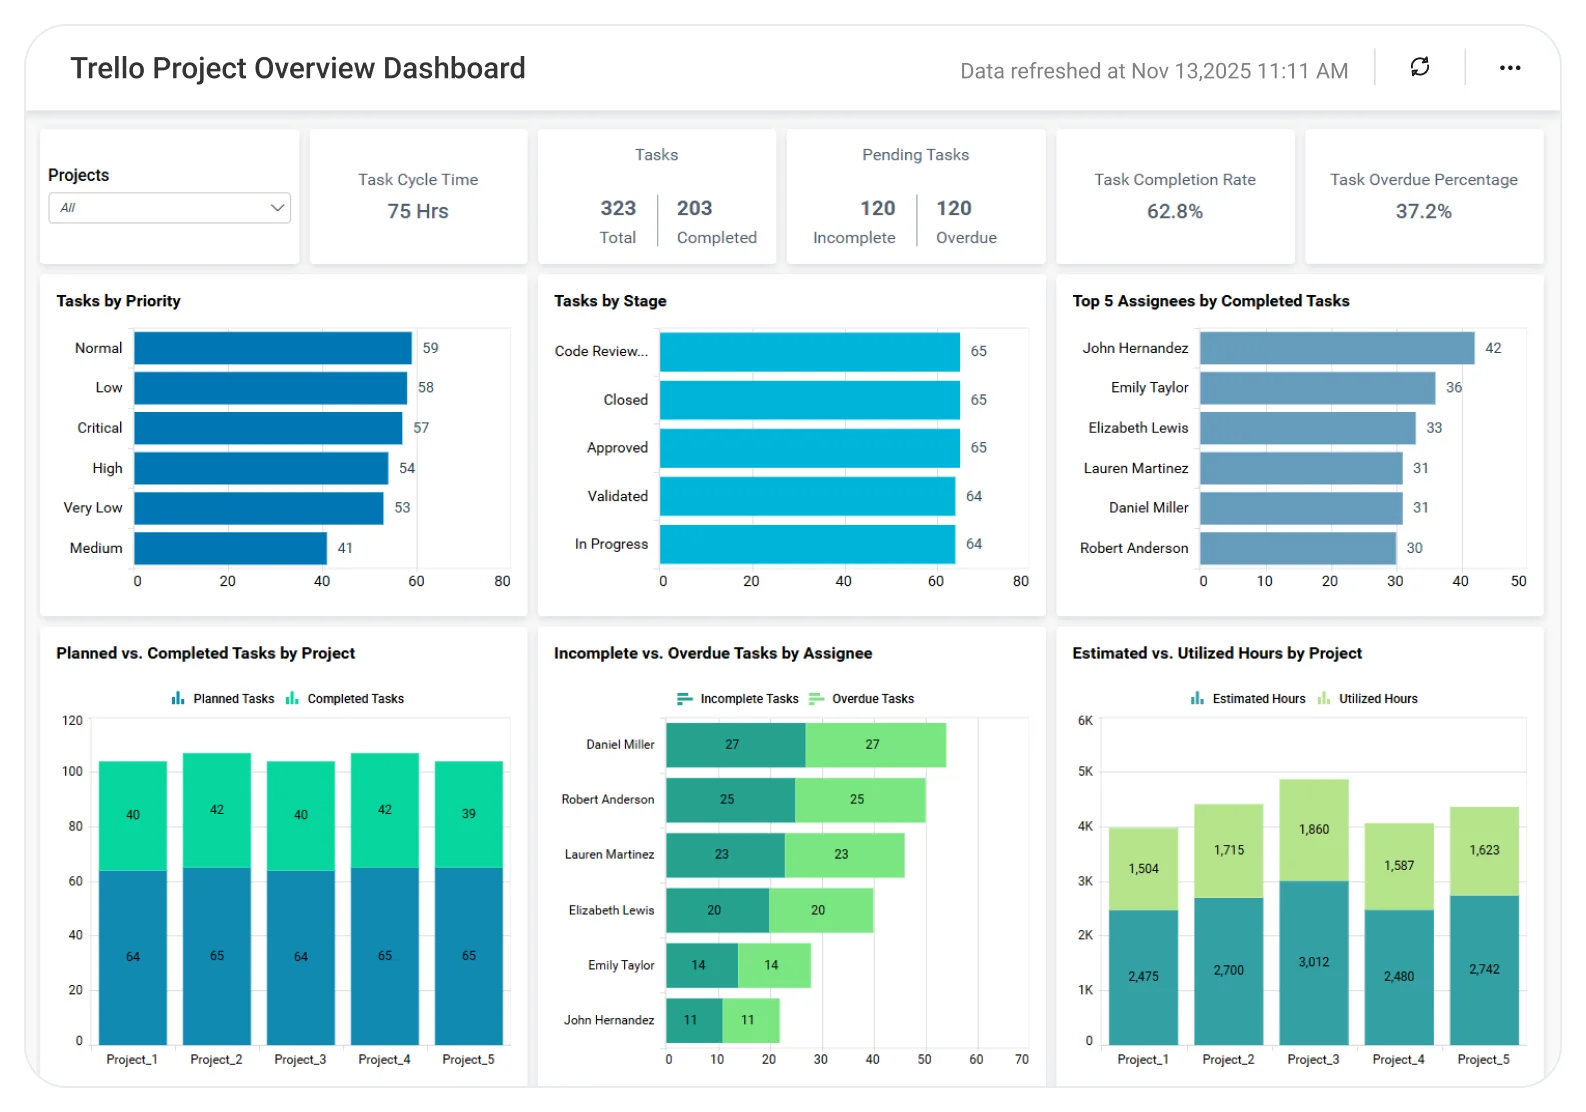
The Trello Project Management Dashboard helps teams analyze boards, tasks, progress, and team activity, enabling better coordination, clear visibility into work status, and more efficient project execution.
TL;DR
-
Project health monitoring: Track project progress, overdue tasks, completion rates, and timeline risks.
-
Team workload visibility: See who’s overloaded or underutilized.
-
Cross-board portfolio view: Manage multiple Trello boards in one dashboard.
-
Cycle-time insights: Measure how long tasks are spent on each list.
-
Executive summaries: Understand portfolio status, delivery trends, and milestone updates.
What is a Trello Project Overview Dashboard?
A Trello Project Management Dashboard offers a real-time snapshot of all your project tasks and current workloads, improving overall workflow efficiency.
In Bold BI, this becomes an interactive command center where PMs can track timelines, spot bottlenecks, and optimize capacity across multiple Trello boards.
Why Trello Project Overview Dashboard Matters
When Trello data is spread across multiple boards, visibility becomes scattered and slow. Bold BI centralizes everything so you can answer:
-
Which projects or tasks are falling behind?
-
Are team members balanced, overloaded, or underutilized?
-
Where are tasks getting stuck?
-
How predictable are delivery timelines across the board?
What You’ll Track
Using Bold BI dashboards, you will track important project overview KPIs such as:
-
Project status overview: Track total projects, overall progress, delays, and open tasks across all boards.
-
Task progress: See open vs. completed work, overdue tasks, average task duration, and checklist completion.
-
Team utilization: Monitor task distribution per member or team, workload balance, and throughput trends.
-
Flow & cycle time: Analyze lead time and cycle time, see time-in-stage, and spot bottlenecks early.
-
Milestones & deadlines: Track upcoming deadlines, missed milestones, delay trends, and completion rates.
All dashboards are fully customizable so you can add your own KPIs, adjust thresholds, or integrate with your workflow tools.
How It Works
-
Apply the Trello Project Management sample with prebuilt KPIs.
-
Blend data with financial tools, support tools, or Jira if needed.
-
Share dashboards using Row Level Security, Single Sign-On, Role-based access control.
-
Set alerts for overdue tasks, stalled cards, and rising workload.
Why Bold BI Is the Right Fit for Trello Project Analytics
-
Combine Trello + ERP + Spreadsheets into One Dashboard.
-
Automate Progress Tracking and Eliminate Manual Updates.
-
Drill from Summary Insights to Task-Level Details.
-
Flexible deployment on cloud or self-hosted environments.
-
Embedding capabilities of the dashboards for internal project portals and executive workspaces.
Compare Options (at a glance)
| Feature | Bold BI | Trello Built-in Views | Spreadsheets / Manual Reporting |
|---|---|---|---|
| Portfolio-level project status across boards | Yes | Limited | Manual |
| Workload & capacity by assignee/team | Yes | Partial | Manual |
| Cycle time/throughput tracking (cards moved, lead time) | Yes | Limited | Manual |
| Bottleneck visibility (stuck cards, aging work items) | Yes | Limited | Manual |
| Custom KPIs & dashboards | Fully customizable | Fixed | Manual |
Frequently Asked Questions
More Articles About Trello Project Overview Dashboard
-
Visualizing and Managing Projects with Bar Charts
This blog explains how bar charts can simplify project management by providing clear visual comparisons of task progress, resource allocation, and timelines. Learn how Bold BI dashboards use bar charts to track project milestones, identify bottlenecks, and improve team productivity.
-
Understanding Data Insights: Tips to Make Better Decisions
This blog explores how to transform raw data into meaningful insights for smarter decision-making. Learn how actionable insights can help leaders anticipate challenges, optimize strategies, and drive continuous improvement across departments.
-
Increase IT Department Performance with Embedded Analytics
This blog highlights how embedded analytics can boost IT department efficiency by integrating real-time dashboards into existing workflows. See how Bold BI enables IT teams to monitor system performance, track incident resolution, and optimize resource utilization.