Lighthouse Ticket Analysis Dashboard
Track ticket volume, resolution time, and backlog health to improve IT service reliability.
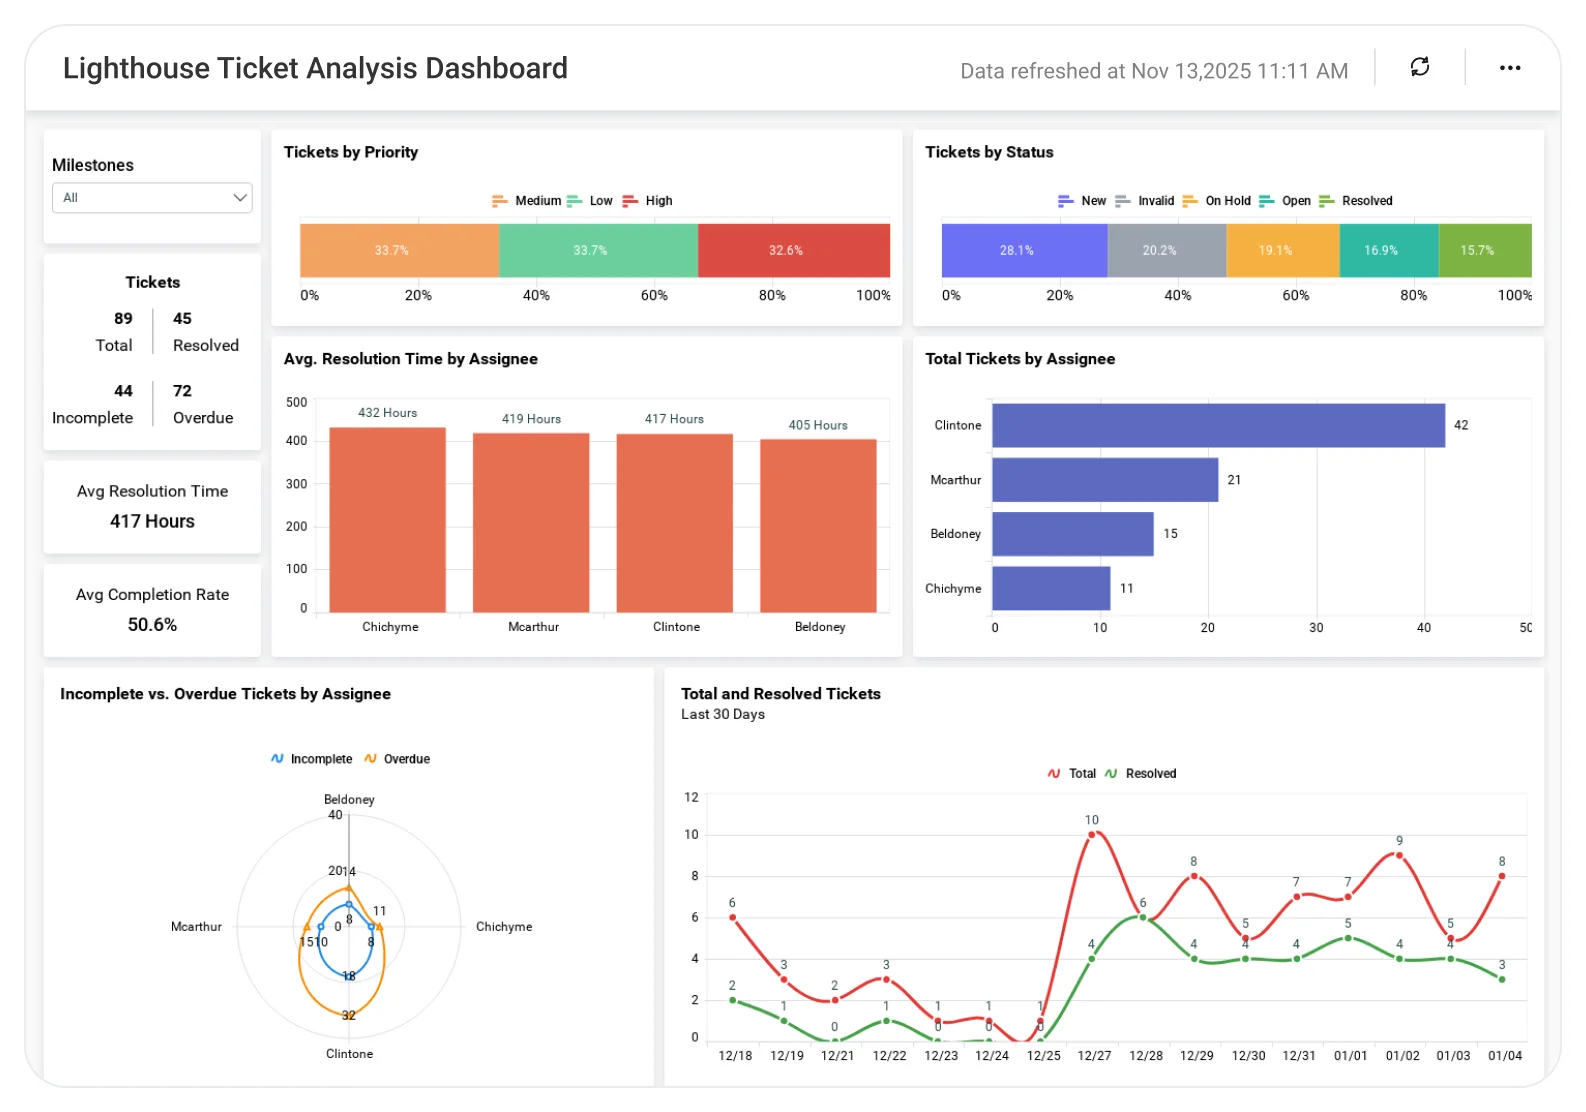
The Lighthouse Ticket Analysis Dashboard helps IT and support teams monitor ticket inflow, resolution efficiency, and recurring issues in one centralized view, supporting better prioritization and workload management.
TL;DR
-
Track ticket volume and backlog trends to understand overall support workload.
-
Monitor open, resolved, and overdue tickets to improve response and resolution speed.
-
Analyze resolution time and SLA adherence to identify service delivery bottlenecks.
-
Identify recurring issues by category or project to support root-cause fixes.
-
Improve IT service quality and issue prioritization with data-driven ticket insights.
What Is a Lighthouse Ticket Analysis Dashboard?
A Lighthouse Ticket Analysis Dashboard is an analytics solution that consolidates issue and ticket data from Lighthouse into a single, decision‑ready view, covering backlog health, response efficiency, and issue patterns.
With Bold BI, ticket data is transformed from raw issue lists into actionable insights that help IT teams move from reactive issue handling to structured service improvement.
Why Lighthouse Ticket Analysis Dashboard Matters
Limited visibility into ticket status and trends slows delivery and impacts system reliability.
When ticket data is reviewed only through basic lists:
-
Backlogs grow without clear prioritization.
-
SLA risks go unnoticed.
-
Recurring issues are not addressed systematically.
-
Leadership lacks a clear service performance view.
A centralized ticket analysis dashboard enables teams to move from firefighting to proactive issue management.
What You’ll Track
Using Bold BI dashboards, you will track important KPIs such as:
-
Ticket volume & status distribution: Open, in-progress, resolved, and overdue tickets to assess backlog health.
-
Resolution time & efficiency: Average and trend-based resolution metrics to identify delays.
-
Priority & severity breakdown: High-, medium-, and low-priority issues to guide focus.
-
Category & project insights: Recurring issue patterns by type or project to support root-cause analysis.
All dashboards are fully customizable, allowing you to add KPIs or metrics as needed.
How It Works
-
Connect Lighthouse ticket and issue data to Bold BI.
-
Apply the Lighthouse Ticket Analysis Dashboard sample.
-
Combine ticket status, priority, and resolution data into a unified model.
-
Analyze insights by project, assignee, category, or time period.
-
Share dashboards with IT teams, engineering leads, and management.
Why Bold BI Is the Right Fit for Lighthouse Ticket Analytics
-
Clarifies backlog and resolution performance: Helps teams see where issues accumulate and why resolution slows down.
-
Supports smarter prioritization of critical issues: Makes high-impact and high-priority tickets easy to identify.
-
Improves accountability across teams and projects: Provides clear visibility into ownership and progress.
-
Reduces manual reporting for IT leadership: Replaces spreadsheet-based ticket summaries with interactive dashboards.
-
Scales across multiple projects and teams: Designed for organizations managing large volumes of issues across products.
Compare Options (at a glance)
| Feature | Bold BI | Lighthouse Reports | Spreadsheets |
| Ticket performance analytics | Yes | Limited | Manual |
| Backlog & SLA insights | Yes | Partial | Manual |
| Priority & category analysis | Yes | Limited | Manual |
| Project & assignee drilldowns | Yes | Limited | No |
| Custom KPIs & dashboards | Fully customizable | Fixed | Manual |