Issue Tracker Dashboard
Understand issue trends and priorities to improve resolution speed and software quality.
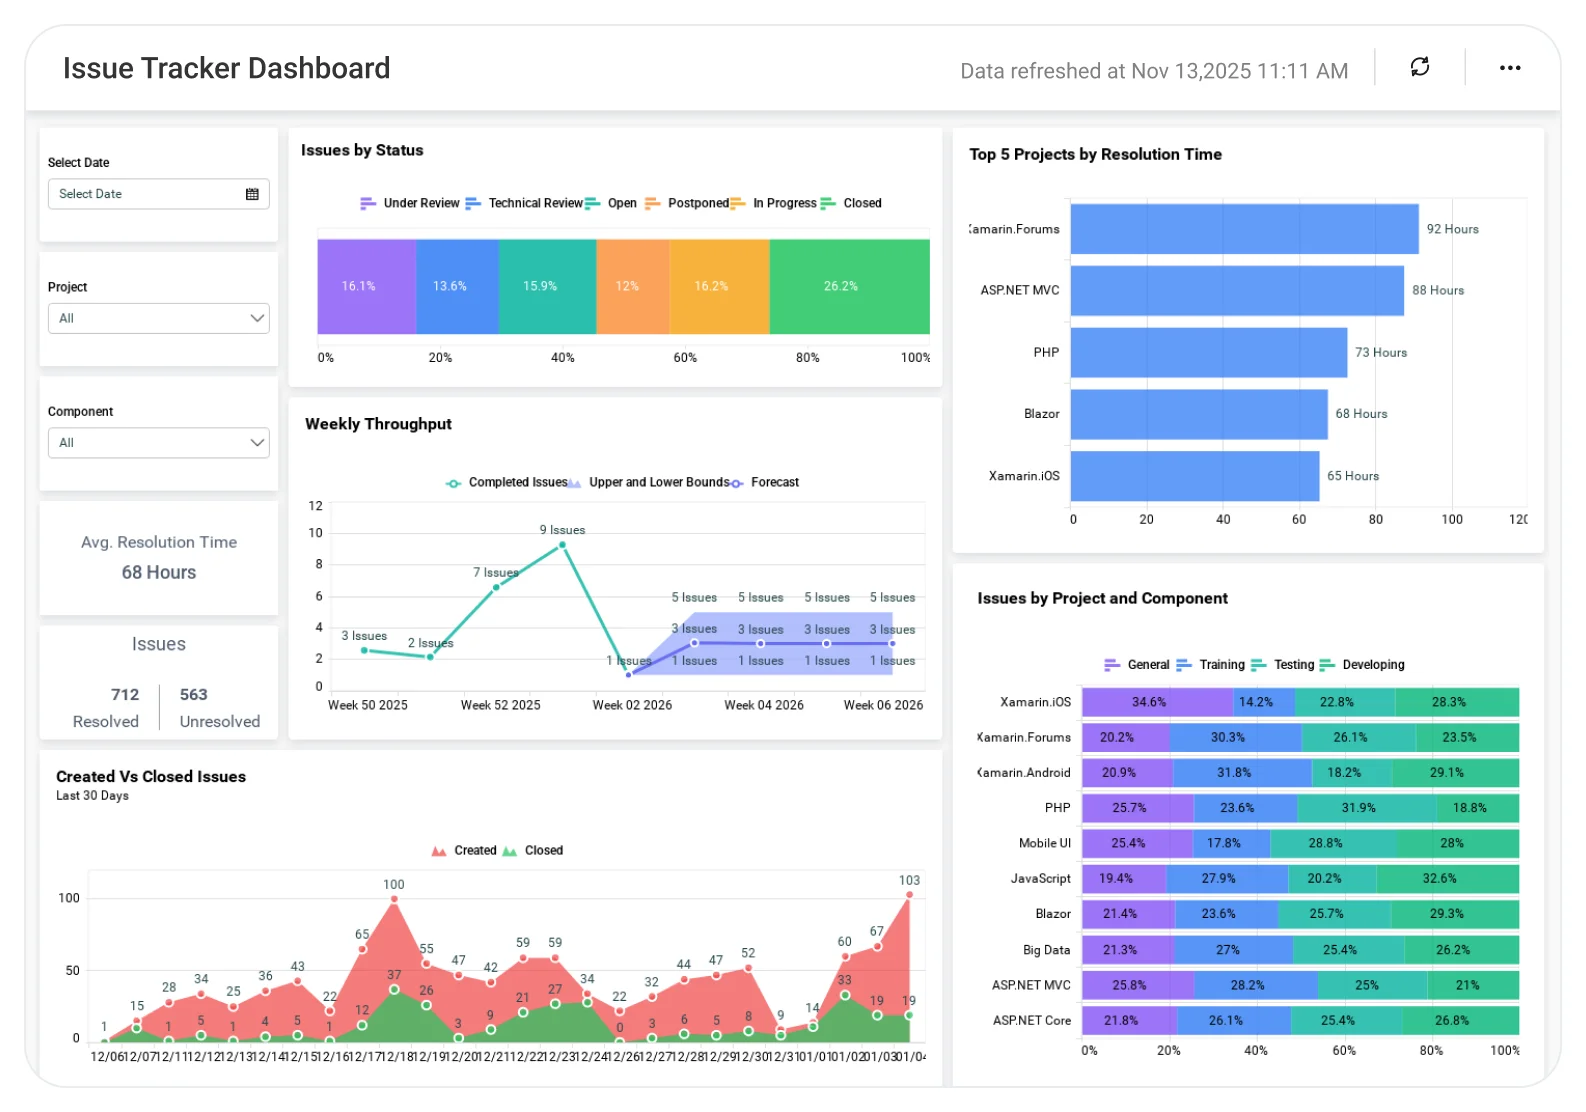
The Issue Tracker Dashboard helps teams analyze reported issues, severity levels, resolution status, and recurring problem areas, enabling better prioritization, faster fixes, and more reliable project delivery.
TL;DR
-
Total unresolved issues.
-
Month-over-month comparison of created vs. closed issues.
-
Average issue resolution time.
-
Issue breakdown by status, project, and component.
-
Outstanding issues by priority and project.
-
Focused views using project and component filters.
What Is an Issue Tracker Dashboard?
An Issue Tracker Dashboard shows created, closed, and unresolved issues, along with resolution time and priority, in a single visual view.
In Bold BI, it becomes an interactive dashboard that helps IT and engineering teams monitor issue health, prioritize fixes, and improve response time across projects.
Why Issue Tracker Dashboard Matters
As issue volume grows, visibility becomes critical.
Without a centralized view:
-
Unresolved issues accumulate quietly.
-
Resolution time increases.
-
High-priority issues get buried.
-
Teams struggle to compare progress month over month.
Bold BI provides a single dashboard to monitor issue volume, status, and resolution thereby, helping teams respond faster and stay aligned.
What You’ll Track
Using Bold BI dashboards, you will track important project overview KPIs such as:
-
Issue Volume & Resolution: Track total unresolved issues, created vs. closed counts, and average resolution time to understand overall issue health.
-
Issue Status Distribution: Monitor how issues move across workflow stages such as open, in progress, closed, postponed, and awaiting review.
-
Project & Component Impact: Identify which projects and components generate the highest number of issues and where problems originate.
-
Priority & Risk Areas: Analyze outstanding issues by priority and project to focus on critical and high-risk areas.
-
Trends Over Time: Compare daily and month-over-month issue creation vs. closure trends to spot spikes, backlogs, or process gaps early.
All dashboards are fully customizable so y6ou can add KPIs, apply filters, and drill down by project, component, or priority for real-time visibility into issue resolution performance.
How It Works
Why Bold BI Is the Right Fit for Issue Tracker Analytics
Bold BI is designed to handle high-volume issue tracking data across multiple projects without performance or visibility gaps.
With Bold BI, you can:
-
Monitor total unresolved issues.
-
Track created vs. closed issues.
-
Analyze average resolution time.
-
Break down issues by priority and project.
-
Review issue status distribution.
-
Deploy dashboards in cloud or self-hosted environments.
Compare Options (at a glance)
| Feature | Bold BI | Native Issue Tools | Spreadsheets |
| Issue status visibility | Yes | Partial | Manual |
| Resolution time tracking | Yes | Limited | Manual |
| Project & component analysis | Yes | Limited | Manual |
| Priority-based insights | Yes | Limited | Manual |
| Custom dashboards | Yes | Limited | Limited |
| Deployment | Cloud / self-hosted | Fixed | Local |
Frequently Asked Questions
More Articles About Issue Tracker Dashboard
-
Issue Tracking with GitKraken Boards Data
 This blog explains how to connect to GitKraken Boards data and visualize important information from your board by connecting with Bold BI® dashboards.