New Relic System Performance Dashboard
Analyze CPU, memory, and system performance trends to improve reliability and reduce downtime risk.
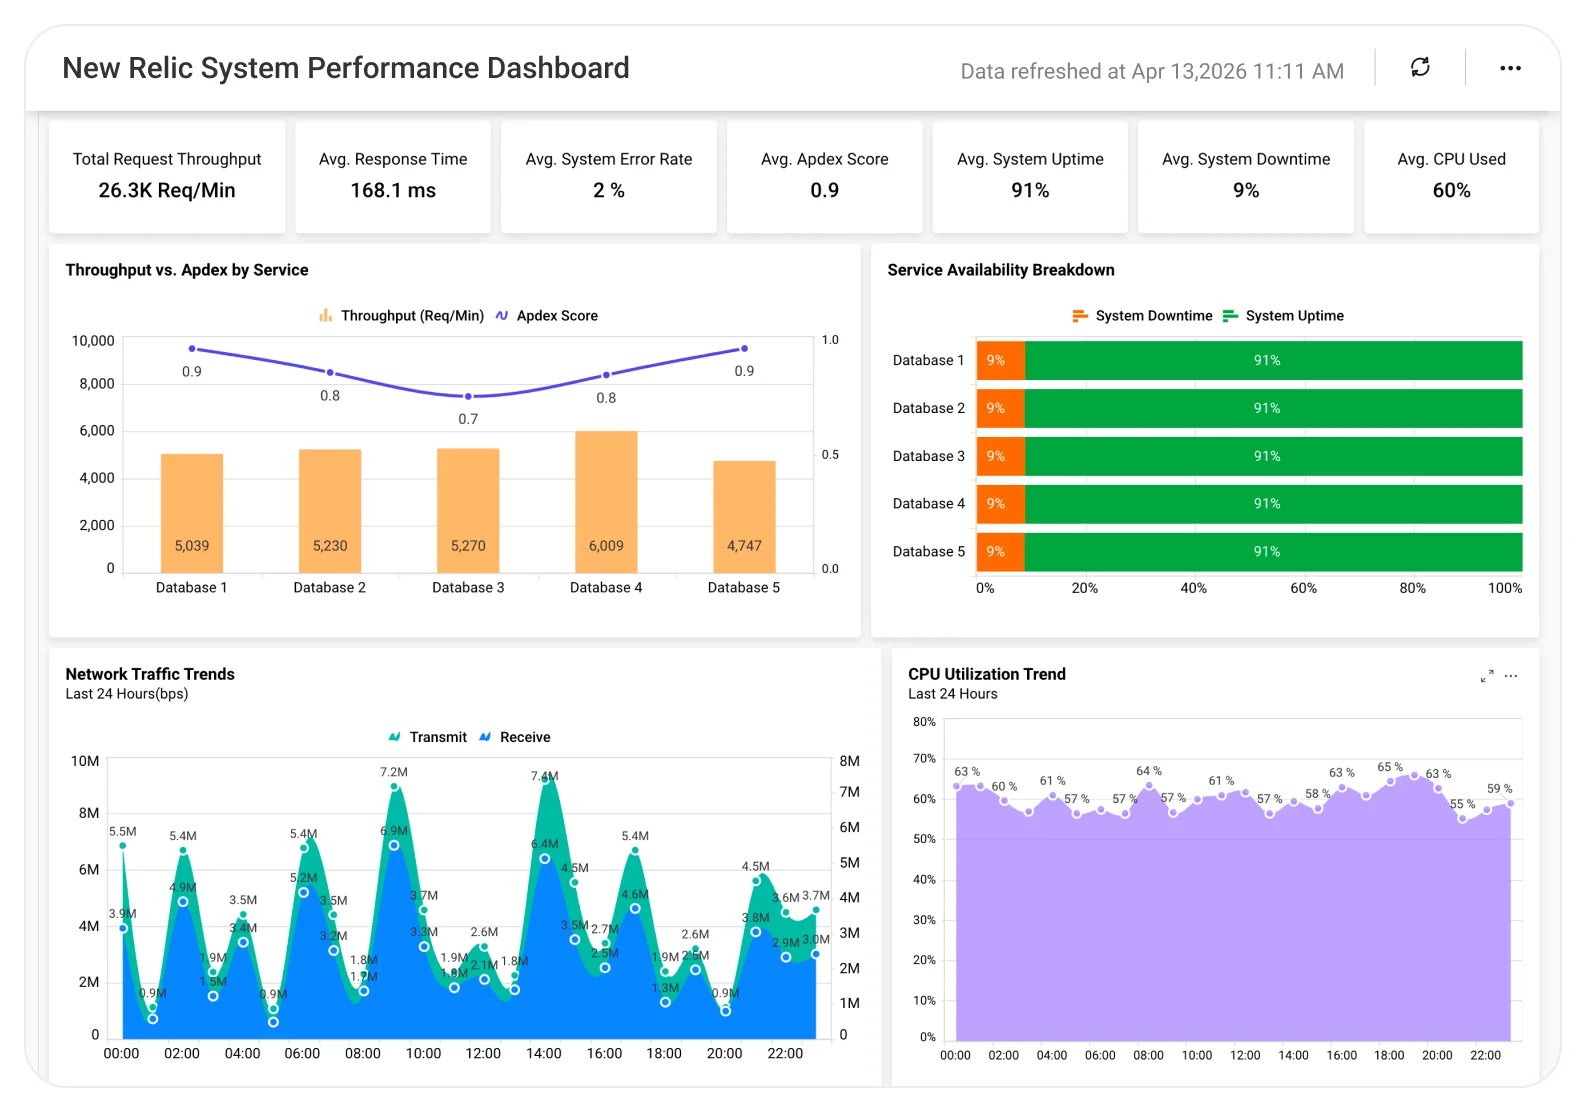
The New Relic System Performance Dashboard helps engineering, SRE, and operations teams track infrastructure health, application performance, and resource usage in one centralized view for faster, evidence-based troubleshooting and capacity planning.
TL;DR
-
Monitor overall system health and performance trends to ensure reliable operations.
-
Track CPU, memory, and resource utilization patterns to detect capacity constraints early.
-
Identify performance bottlenecks, spikes, and anomalies before they impact users.
-
Compare system behavior across hosts or services to pinpoint underperforming components.
-
Support faster troubleshooting and capacity planning with data-driven performance insights.
What Is a New Relic System Performance Dashboard?
A New Relic System Performance Dashboard is an analytics solution that helps teams understand how systems and applications perform under real workloads.
In Bold BI, this dashboard connects directly with New Relic data to consolidate infrastructure metrics, performance indicators, and trends for informed decisions around system optimization and operational stability.
Why New Relic System Performance Dashboard Matters
System performance directly impacts application reliability, user experience, and operational efficiency.
When performance data is reviewed only through raw monitoring views:
-
Performance degradation is detected late.
-
Root causes are harder to isolate.
-
Capacity planning lacks historical insight.
-
Incident response becomes reactive.
A centralized analytics dashboard enables teams to move from reactive monitoring to proactive performance analysis and optimization.
What You’ll Track
Using Bold BI dashboards, you will track important KPIs such as:
-
CPU utilization trends: Processor usage over time to identify performance saturation or spikes.
-
Memory usage patterns: Memory consumption and availability to detect leaks or capacity constraints.
-
System response indicators: Performance response metrics to understand system load behavior.
-
Host & service comparison: Performance differences across servers or applications to pinpoint problem areas.
All dashboards are fully customizable so you can add KPIs or metrics as needed.
How It Works
-
Connect your New Relic account data to Bold BI
-
Apply the New Relic System Performance Dashboard sample.
-
Combine infrastructure, application, and metric data in one unified view.
-
Analyze insights by host, service, metric, or time period.
-
Share dashboards with engineering, SRE, and operations teams.
Why Bold BI Is the Right Fit for Engineering & Operations Teams
-
Unified performance visibility: Bring New Relic system metrics into a single analytics dashboard.
-
Centralized performance analysis: Evaluate resource usage and system behavior together.
-
Comparative insights: Compare hosts or services to identify performance inconsistencies.
-
Actionable drilldowns: Investigate spikes, anomalies, or sustained performance degradation in detail.
-
Flexible deployment: Deploy dashboards in cloud or self-hosted environments to fit DevOps workflows.
Compare Options (at a glance)
| Feature | Bold BI | New Relic Views | Spreadsheets |
| System performance analytics | Yes | Limited | Manual |
| Cross-host comparison | Yes | Partial | Manual |
| Historical trend analysis | Yes | Limited | Manual |
| Bottleneck identification | Yes | Limited | No |
| Custom KPIs & drilldowns | Fully customizable | Fixed | Manual |