Outlook Calendar Events Dashboard
Understand schedules and event patterns to improve time management and planning.
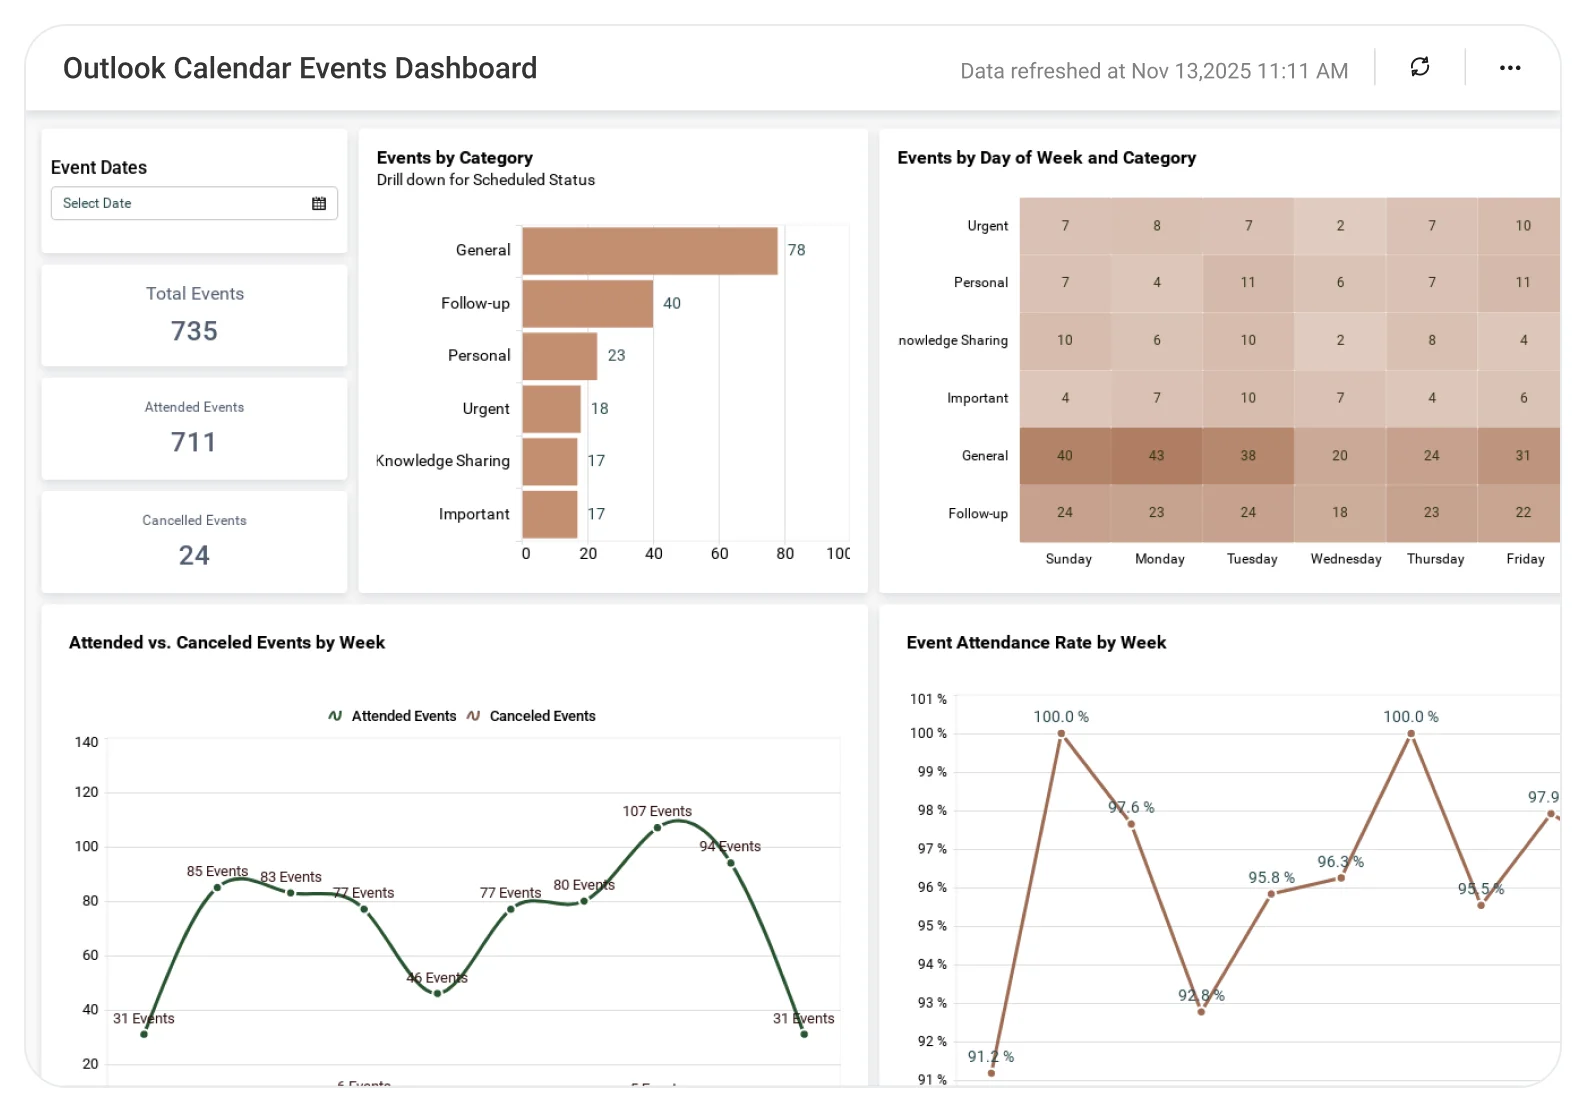
The Outlook Calendar Events Dashboard helps teams analyze meetings, events, and time allocation across calendars, enabling better scheduling, workload balance, and more effective use of time.
TL;DR
-
Total scheduled, attended, and cancelled events.
-
Time spent in meetings (minutes and percentage).
-
Average meeting duration and meeting types.
-
Daily, weekly, and monthly meeting trends.
-
Upcoming events for next week.
What Is an Outlook Calendar Events Dashboard?
An Outlook Calendar Events Dashboard visualizes meeting activity, time spent, and scheduling patterns from Outlook calendars.
In Bold BI, this means interactive KPIs, charts, and grids that show how many meetings you have, how long they last, and how your time is distributed.
Why Outlook Calendar Events Dashboard Matters
Meetings silently consume productivity.
Without visibility:
-
Teams spend too much time in low-value meetings.
-
Meeting overload goes unnoticed.
-
Time allocation across work types is unclear.
-
Schedules are reactive instead of intentional.
Bold BI gives you one visual view of your calendar data, helping teams manage time better and work smarter.
What You’ll Track
-
Meeting volume & status: Track scheduled, attended, and cancelled events to understand meeting load.
-
Time spent in meetings: Measure total meeting time in minutes and as a percentage of working time.
-
Meeting duration & categories: Analyze meetings by length and by category such as follow-ups, knowledge sharing, personal tasks, or important work..
-
Scheduling trends over time: Monitor meetings by day, week, and month to spot patterns and overload periods.
All dashboards are fully customizable so you can add KPIs or metrics as needed.
How It Works
-
Connect Outlook calendar data.
-
Apply the Outlook Calendar Events Dashboard sample.
-
Analyze meetings using KPIs, charts, and grids.
-
Track trends by day, week, and month.
-
Review upcoming events to plan ahead.
Why Bold BI Is the Right Fit for Outlook Calendar Events Analytics
Bold BI is designed for analyzing productivity data and embedding insights directly into internal tools.
With Bold BI, you can:
-
Analyze Outlook calendar data in real time.
-
Track meeting volume, duration, and categories.
-
Monitor time spent in meetings vs. focused work.
-
Share insights with teams or managers securely.
-
Deploy dashboards in cloud or self-hosted environments.
Compare Options (at a glance)
| Feature | Bold BI | Outlook Views | Spreadsheets |
| Meeting analytics | Yes | Limited | Manual |
| Time-spent analysis | Yes | No | Manual |
| Trend analysis | Yes | No | Manual |
| Interactive filtering | Yes | No | Manual |
| Deployment | Cloud / self-hosted | SaaS only | Local |
Frequently Asked Questions
More Articles About Outlook Calendar Events Dashboard
-
Unlock the Power of Your Outlook Calendar Data with BI
 This blog highlights the advantages of using BI tools like Bold BI to analyze calendar data. Covers visual insights, time management trends, collaboration benefits, predictive forecasts, and secure data-sharing.