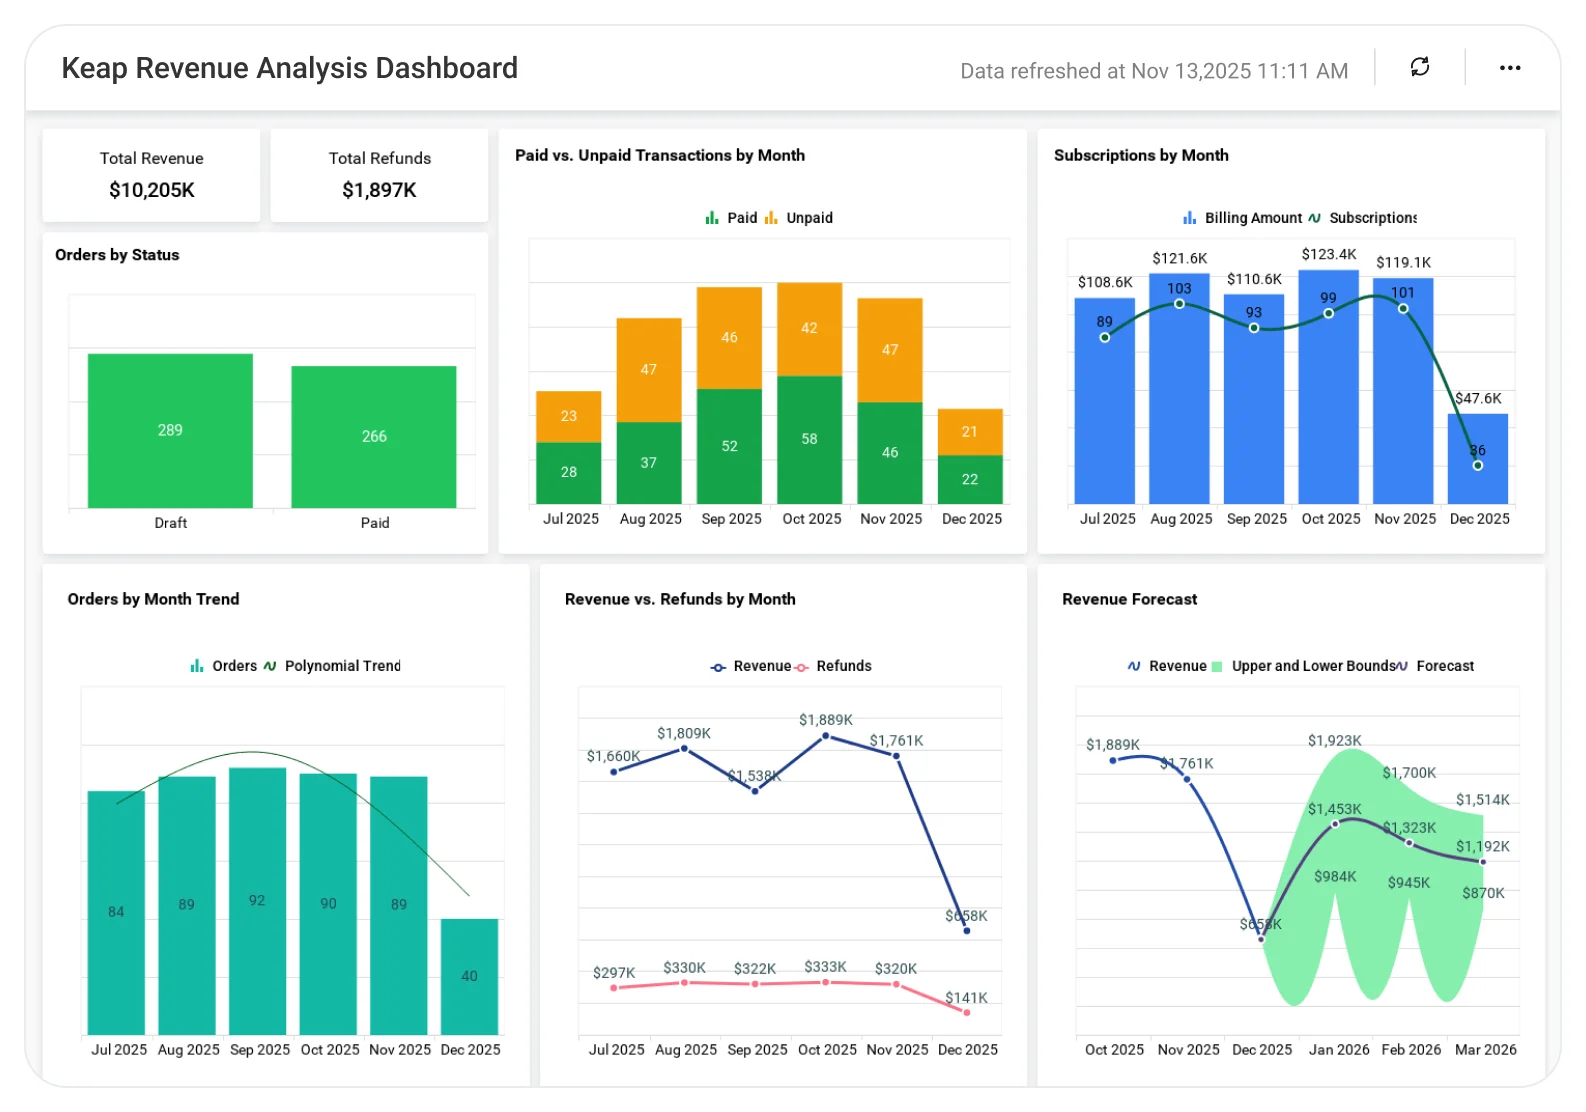
Chargebee Subscription Overview Dashboard
Understand subscription performance to improve recurring revenue and reduce churn.
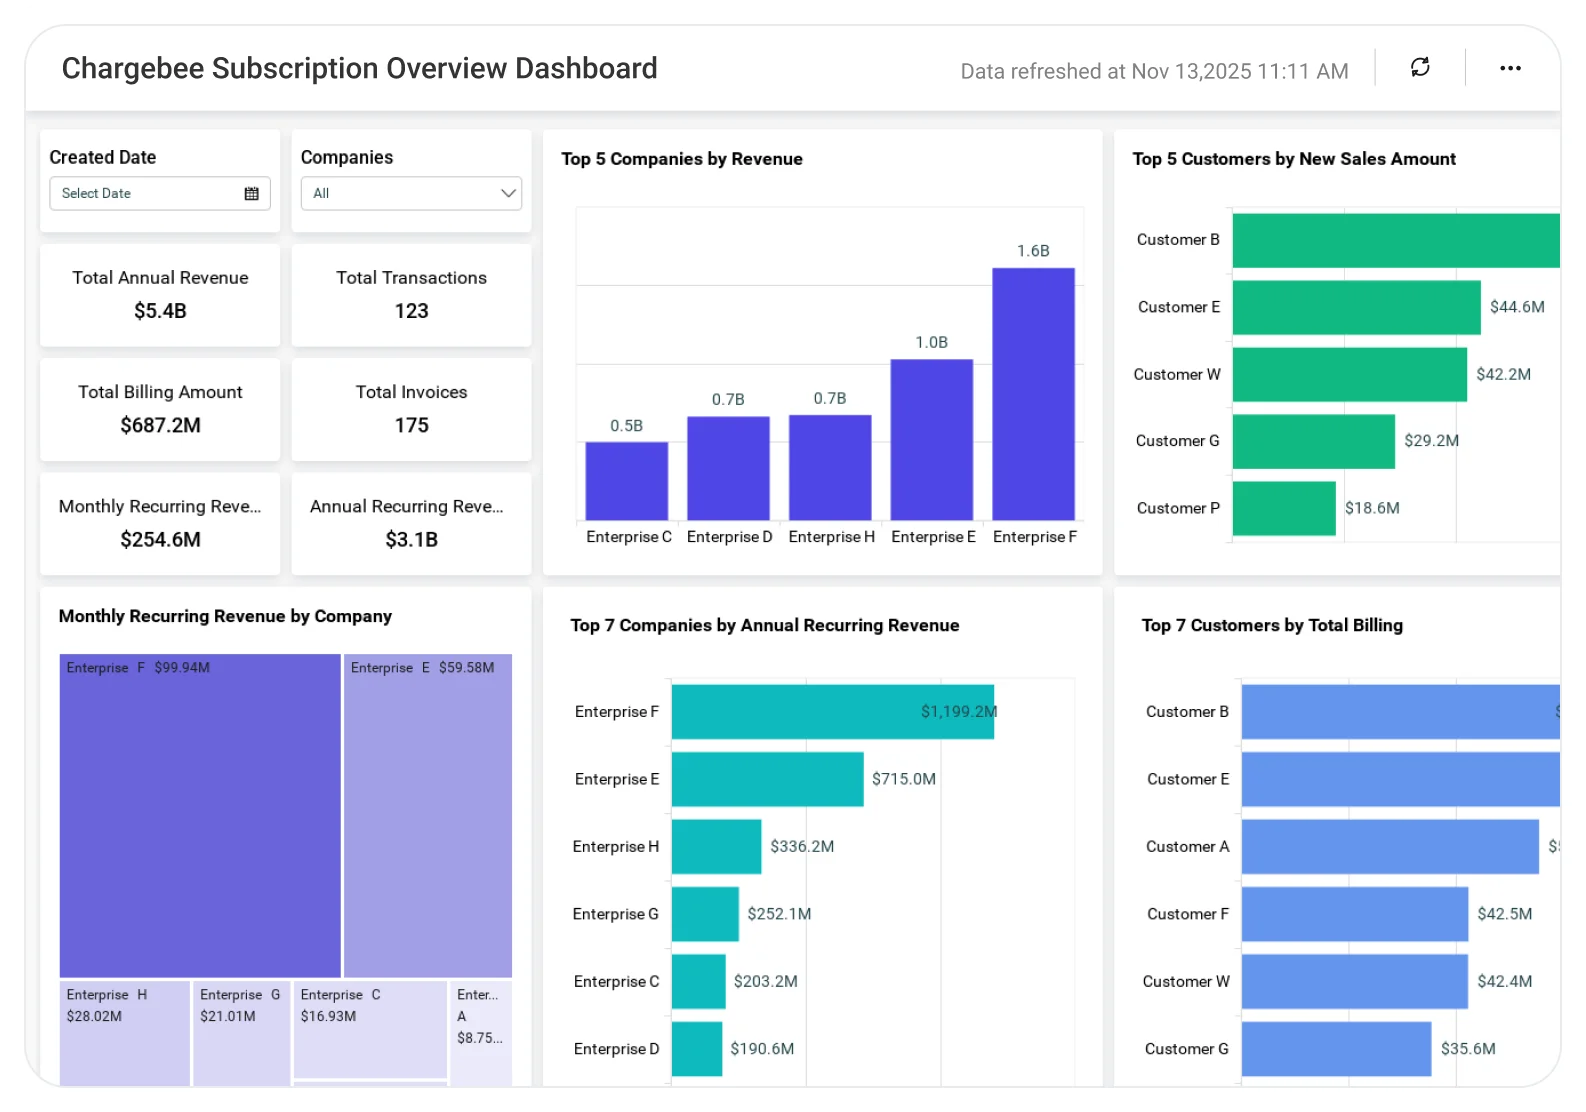
The Chargebee Subscription Analytics Dashboard helps teams analyze MRR, churn, customer growth, and subscription trends, enabling better revenue forecasting, retention strategies, and sustainable business growth.
TL;DR
-
Total annual revenue (ARR) and monthly recurring revenue (MRR).
-
Number of transactions processed.
-
Unpaid invoice visibility.
-
Revenue trends over time.
-
Clear signals on subscription business health.
What Is a Chargebee Subscription Overview Dashboard?
A Subscription Analytics Dashboard is a visual analytics tool that tracks recurring revenue, transactions, billing status, and subscription performance.
In Bold BI, it becomes an interactive dashboard that helps teams analyze subscription health, monitor revenue streams, and make data-driven growth decisions, without manual reporting.
Why a Chargebee Subscription Overview Dashboard Matters
Running a subscription business means constantly balancing growth, retention, and revenue predictability.
Without a centralized subscription dashboard:
-
Revenue trends are harder to interpret.
-
Billing gaps and unpaid invoices go unnoticed.
-
Growth decisions rely on assumptions.
Bold BI turns Chargebee subscription data into actionable insights, helping teams reduce churn risk, improve cash flow, and maximize lifetime value.
What You’ll Track
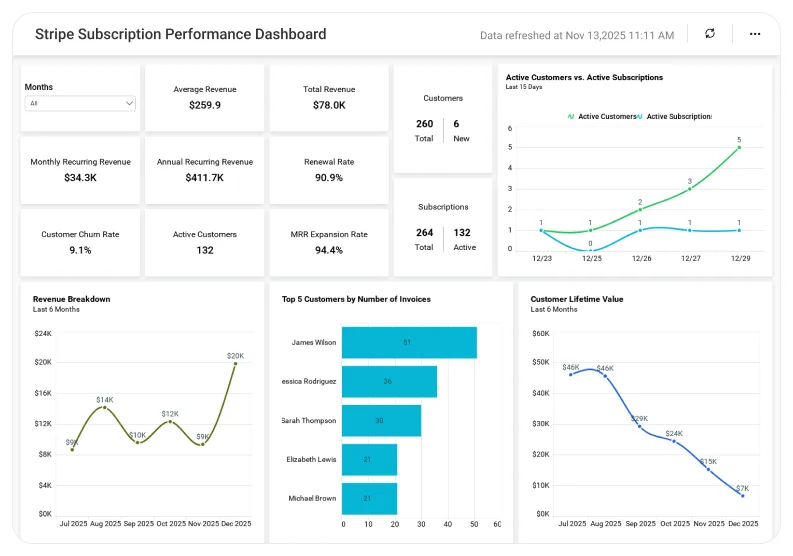
Using Bold BI dashboards, you will track important subscription overview KPIs such as:
-
Recurring revenue metrics: Track total annual revenue (ARR) and monthly recurring revenue (MRR) to measure predictable income.
-
Transaction activity: Monitor the number of subscription transactions to understand billing volume and customer activity.
-
Billing health insights: Identify unpaid invoices early to protect cash flow and reduce revenue leakage.
-
Revenue performance trends: Analyze revenue changes over time to evaluate growth and stability.
All dashboards are fully customizable, allowing you to add KPIs or metrics as needed.
How it Works
-
Apply the Chargebee Subscription Overview dashboard sample.
-
Monitor revenue, transactions, and invoices in real time.
-
Share dashboards with finance and leadership teams.
-
Embed dashboards into internal finance or growth tools.
Why Bold BI Is the Right Fit for Chargebee Subscription Analytics
Bold BI is designed to handle high-volume subscription and revenue data without performance or visibility gaps.
With Bold BI, you can:
-
Monitor active subscriptions and churn rate.
-
Track monthly recurring revenue (MRR) and annual recurring revenue (ARR).
-
Analyze payment failures and recovery trends.
-
Break Down revenue by plan, region, or customer segment.
-
Forecast subscription growth and revenue trends.
-
Deploy dashboards in cloud or self-hosted environments.
Compare Options (at a glance)
| Feature | Bold BI | Chargebee Reports | Spreadsheets |
|---|---|---|---|
| Subscription growth analytics | Yes | Limited | Manual |
| MRR/ARR tracking & trends | Yes | Partial | Manual |
| Churn, retention & reactivation insights | Yes | Limited | Manual |
| Plan, addon & coupon performance | Yes | Limited | Manual |
| Dunning & failed payment impact visibility | Yes | Partial | Manual |
| Custom KPIs & dashboards | Fully customizable | Fixed | Manual |
Frequently Asked Questions
More Articles About Chargebee Subscription Overview
-
Efficient Support Management with Embedded Analytics
 This blog shows how embedding dashboards into support applications gives real-time insight into ticket activity and helps teams address issues quickly without switching tools.
-
Enhance Your Finances with an Embedded Subscription Management System
This blog explores how embedded analytics helps subscription businesses track recurring revenue, billing activity, and financial performance in one unified view.