Monitor service performance, system reliability, and operational risk with real-time IT dashboards. IT operations teams manage complex, always-on environments from support tickets and infrastructure monitoring to uptime and service reliability. To operate effectively, teams need clear visibility into performance and risk without relying on disconnected tools or manual reports.
Bold BI provides real-time, customizable IT operations dashboards that unify service desks, infrastructure, and operational data helping IT teams reduce downtime, improve service quality, and understand the business impact of IT performance.
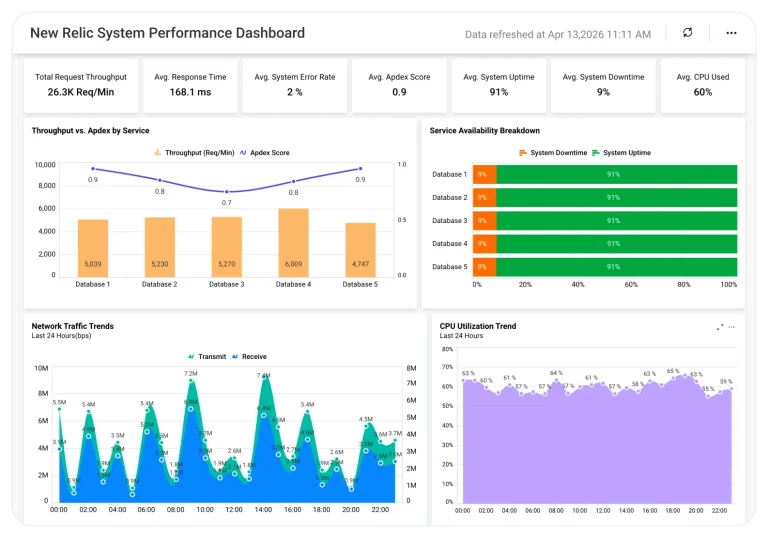
New Relic System Performance Dashboard
Track system and application performance with our New Relic System Performance Dashboard. Visualize uptime, latency, and infrastructure metrics in real time.
JobNimbus Task Management Dashboard
Monitor your project to gain insights into task progress and project timelines.
Todoist Task Management Dashboard
Manage tasks, track priorities, and monitor completion rates with Todoist integration to enhance task organization and workflow efficiency.
Lighthouse Ticket Analysis Dashboard
Improve ticket resolution and reduce backlog with clear Lighthouse issue insights.
Pull Requests Analysis Dashboard
Analyze GitHub pull request volume, review time, and merge cycles for workflow efficiency.
Repository Issues Analysis Dashboard
Analyze GitHub repository issues for improved issue management efficiency.
Cyber Protection Overview Dashboard
Monitor cyber threats to gain clarity into your cyber security posture.
Asana Project Management Dashboard
Track task and project statuses, hours worked per project, and more.
Issue Tracker Dashboard
Track issue status, average resolution time, and more.
Forum Management Dashboard
Track posts and views per forum, posts with the most votes, and more.
Outlook Calendar Events Dashboard
Track time spent in meetings, scheduled events, and more.
Intervals Project Management Dashboard
Enjoy a complete overview of your team’s task progress and overall project metrics.
Outlook Calendar Events Organizer
Enjoy a complete overview of your calendar’s scheduled events.
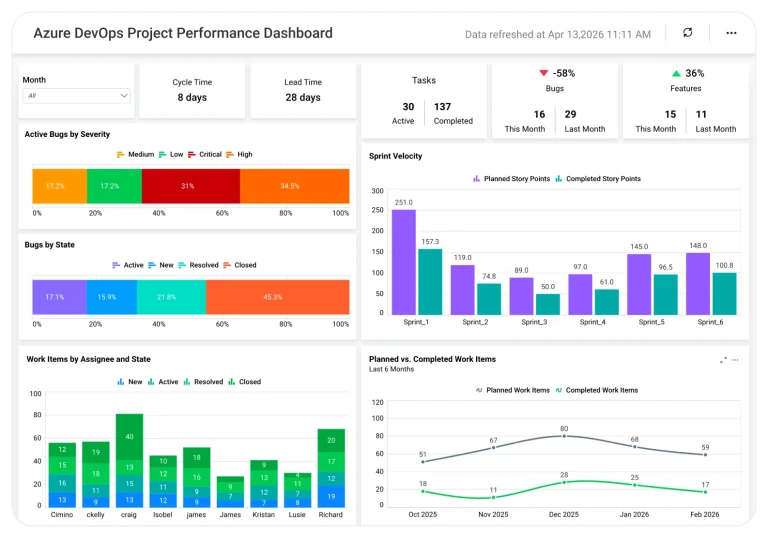
Azure Devops Project Performance
Track sprint velocity, bug status and severity, and more.
Trello Project Management Dashboard for Project Managers
Analyze every aspect of your IT projects managed in Trello, including task completion rates, planned and completed tasks, estimated and utilized hours by project, and top task performers.
Toggl Project Time Tracking Dashboard
Effortlessly track Toggl Project metrics such as planned versus completed tasks by project, completion rates, and incomplete and overdue tasks by assignees.
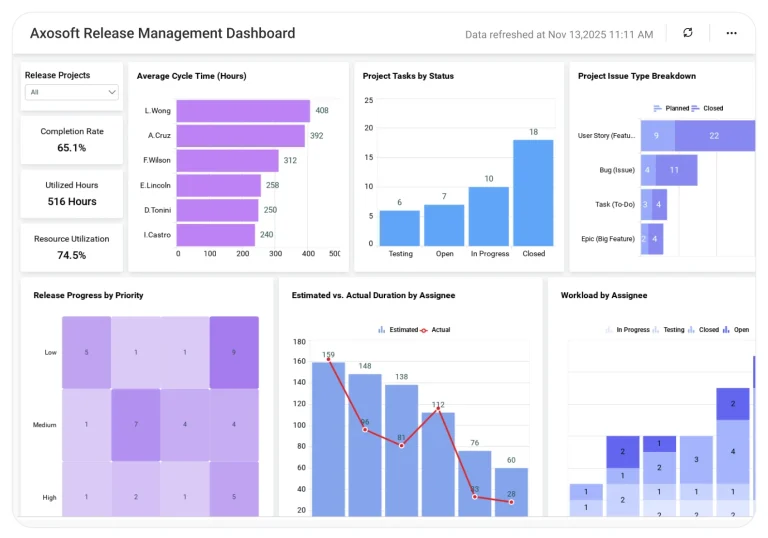
Axosoft Project Release Management Dashboard
Track cycle time, scope changes, release status, and more.
Project Management Dashboard
Track SLAs, financial metrics, project completion times, and more
Customer Service Performance
Track support ticket resolution times, system downtime, and more.
Podio Project Management Dashboard
Easily track Podio Project Management metrics such as incomplete versus overdue tasks by level of priority, completion rates by project, and average task cycle time.
Harvest Project Time Tracking Dashboard
Track budgeted versus tracked hours, project progress, tracked hours by assignee, and more.
Snowflake Usage Overview Dashboard
Track support ticket resolution times, system downtime, and more.
Why IT Operations Teams Choose Bold BI
Real-Time Operational Visibility: Monitor support tickets, system health, server uptime, and performance metrics as they happen.
Improved Service Reliability: Track incidents, response times, and resolution SLAs to improve customer satisfaction.
Infrastructure Monitoring: Analyze server downtime, availability trends, and capacity utilization.
Operational Efficiency: Identify recurring issues, bottlenecks, and resource constraints.
Business Impact Awareness: Understand how IT performance affects customer experience and financial outcomes.
Secure Analytics: Role-based access, governed data sharing, and cloud or self-hosted deployment options.
What You’ll Track
Bold BI’s IT operations dashboards put critical KPIs at your fingertips, helping teams improve reliability and efficiency.
Service Desk Performance: Monitor ticket volume, open vs. closed tickets, response times, and SLA compliance.
Infrastructure Health: Analyze server uptime, performance metrics, and capacity utilization trends.
Service Quality & Impact: Measure customer satisfaction, service reliability, and IT’s impact on business continuity.
All dashboards are fully customizable so you can add KPIs or metrics as needed.
Bold BI for IT Operations – Common Metrics
With fully customizable dashboards, you can track the KPIs that matter most:
Support ticket volume and status
Incident response and resolution times
SLA compliance and backlog trends
Server uptime and downtime duration
System availability and performance metrics
Mean time to resolve (MTTR)
Infrastructure capacity and utilization
User satisfaction and service quality indicators
All dashboards can be customized for IT support, infrastructure operations, DevOps, and service management teams.
How It Works
Connect Data Sources: Integrate ITSM tools, monitoring systems,SQL databases, spreadsheets, or cloud platforms.
Use Pre-Built or Custom Dashboards: Start quickly with IT operations dashboard samples or design your own.
Blend Key IT Data: Combine service desk, infrastructure, and performance information to answer key questions such as:
Where are service bottlenecks occurring?
Which systems experience the most downtime?
Are we meeting SLAs and user expectations?
Collaborate Securely: Share dashboards across IT teams and leadership with governed access.
Stay Proactive: Set alerts for critical issues like downtime spikes or SLA breaches.
Trusted & recognized
Analytics that Wins Awards and Users.
Recognized by G2, TrustRadius and Visual Studio Magazine for delivering standout performance and value.
I appreciate Bold BI for making it easier to provide reporting for our customers, allowing both our analysts and customers to easily build and publish reports. The ability to build dashboards and modify queries for specific outcomes is very user-friendly. I value the mobile readiness of the app and its integration capabilities with API structures. The addition of AI features is impressive. The economic pricing model and the effective partnership, which includes consistent and helpful support, make it an invaluable tool for our OEM model.
Ravi S.
The support from Bold is unmatched. They do not charge extra for support and it is excellent anyway. All our tickets and questions are quickly answered with authoritative and precise guidance. This is important at the product is complex, powerful and mature. To get the most out of the tool, the level of support they provide is essential.
Murph M.
It was easy to implement data visualizations into our product. The standard widgets allowed us to build professional looking dashboards, and a robust API provided excellent control of the development and runtime process from within our application.
Scott Y.
RECOGNITION
Users Love Us
Visual Studio Reader's Choice - 2025
Leader - Fall 2025
High Performer - Fall 2025 EMEA
Regional Leader - Fall 2025 AMERICAS
TrustRadius Tech Cares
Capterra - 4.9/5
G2- 4.4/5
GetApp - 4.9/5
Software Advice - 4.9/5
Frequently Asked Questions
Yes. Bold BI connects with ticketing systems, monitoring platforms, Excel/SQL, cloud apps, or REST APIs, and other data sources.
Absolutely. Bold BI supports near real-time data refresh for continuous monitoring.
Yes., each team can have customized dashboards with role-based access to relevant KPIs.
Yes. Bold BI supports self-hosted deployment for organizations with strict security or compliance requirements.
Most teams start visualizing IT KPIs within hours. Complex integrations depend on your environment.
More Articles About Information Technology Dashboard Examples
This blog breaks down what dashboard reporting tools are, how they benefit organizations, and the key features to consider when choosing one. You’ll also discover five top tools leading the market in 2025 and learn why Bold BI® stands out as a powerful solution for modern reporting needs.
This blog explains how, in today’s fast-paced business environment, alignment with goals, performance metrics, and stakeholder expectations is maintained using quarterly business review dashboards. It highlights how these dashboards transform reviews into interactive, real-time, and action-oriented discussions, enabling stakeholders to explore live data, uncover trends, and make confident decisions collaboratively.